
Stocks continued to whipsaw this week as investors considered the potential for a Fed pivot or pause to continue.
Much of the pessimism was due to better-than-expected economic indicators, which showed that the economy is still humming along. Retail sales jumped by 0.6% for December, beating estimates of 0.3% as well as previous readings. Consumers have continued to spend in the wake of a strong labor market. Initial jobless claims for the week ending January 13 came in at 187,000 – the lowest number since September 2022 – and well below estimates of 208,000. Housing data was mostly positive. Building permits jumped to a seasonally-adjusted annual rate of 1.495 million in December, beating estimates by a wide margin and exceeding November’s number by 1.9%. However, housing starts for December came in at 1.46 million, a drop of 4.3% from November’s figure. Meanwhile, homebuyers seem to be making a comeback as mortgage rates dipped again last week, reaching their lowest level since May 2023. However, there were some negative economic releases, including several regional manufacturing indicators. The mixed picture ultimately kept investors unsure about the direction of the economy and Fed policy, leading to mixed trading activity during the week.
Heading into next week, data will be light. However, it will feature one of the most important metrics in recent quarters – the Core PCE Price Index – which is the Fed’s preferred measure of inflation and crucial in shaping its interest rate policy. Core PCE has trended slightly higher in recent months, and analysts expect the trend to continue. On Friday, the number for December is expected to come in at 0.2% compared to the 0.1% rise reported in November. This might throw cold water on the Fed’s potential to cut rates as soon as hoped for by the market. Investors will also be treated to personal income and spending data on Friday. These metrics have continued to trend sideways and slightly higher, indicating the consumer economy is still going strong yet starting to sputter out. Both data points are set to both clock in at 0.3% for December. On Thursday, investors will see the preliminary estimate for Q4’s GDP growth rate. The economy grew by an annualized rate of 4.9% during Q3 and is expected to slow down, growing by around 2.3% in the final quarter of 2023.
Given this economic backdrop, let us see how this impacts the performance of various investment strategies.
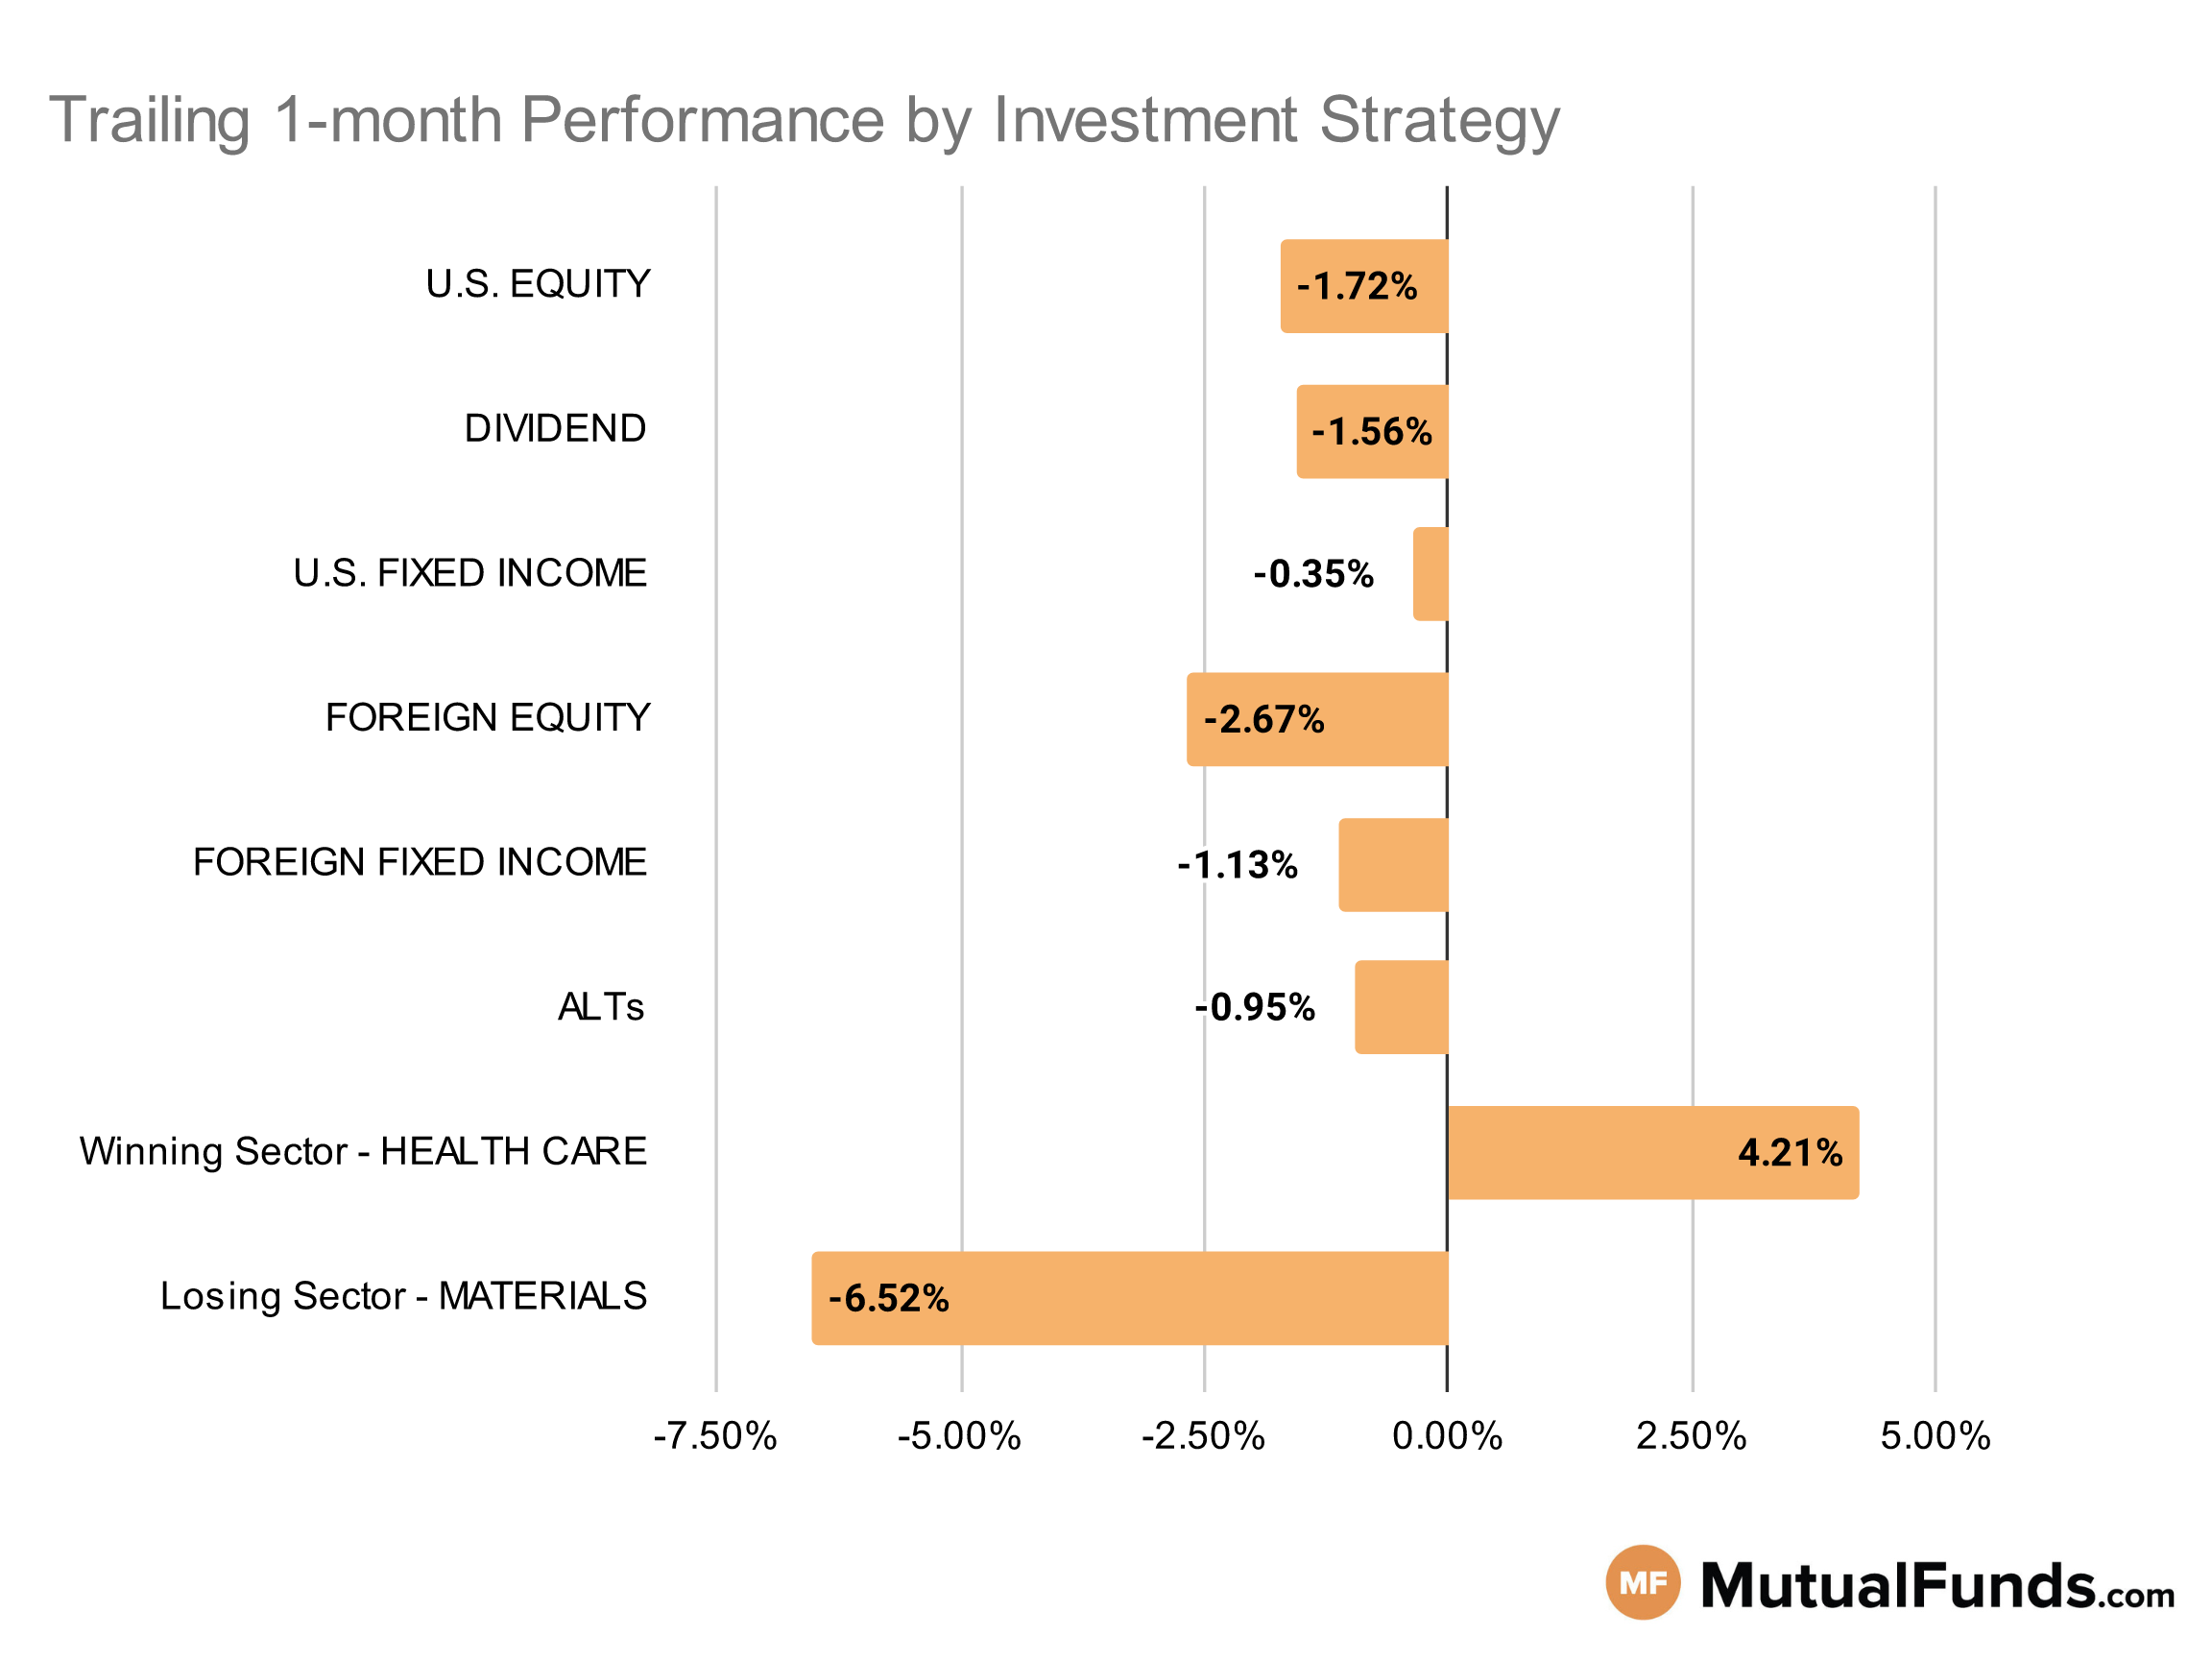
Investment Strategy Scorecard
Overall, the U.S. stock markets were marginally up for the rolling month.
Growth focused strategies, especially biotechnology and cannabis, along with Japanese equity posted some of the strongest performances over the rolling month. Meanwhile, tactical/concentrated and commodity strategies struggled.
U.S Equity Strategies
Large cap growth strategies finally posted positive results after a long time, while small cap strategies struggled over the rolling month,
Winning
- Alger Focus Equity Fund (ALZFX) , up 2.62%
- Wells Fargo Premier Large Company Growth Fund (EKJAX), up 2.36%
- Invesco Dynamic Large Cap Growth ETF (PWB) , up 1.85%
- Franklin LibertyQ U.S. Equity ETF (FLQL), up 0.78%
Losing
- Invesco S&P SmallCap 600 Revenue ETF (RWJ) , down -4.86%
- iShares S&P Small-Cap 600 Value ETF (IJS), down -4.88%
- BNY Mellon Institutional S&P 500 Stock Index Fund (DSPIX) , down -20.79%
- Lazard US Equity Concentrated Portfolio (LEVOX), down -44.2%
Dividend Strategies
Several dividend strategies, including international and high quality, continue to post positive performances over the rolling month.
Winning
- SPDR® S&P International Dividend ETF (DWX) , up 0.58%
- O’Shares U.S. Quality Dividend ETF (OUSA), up 0.37%
- DWS CROCI Equity Dividend Fd (KDHSX) , up 0.21%
- VALIC Company I Dividend Value Fund (VCIGX), up 0.17%
Losing
- WisdomTree U.S. SmallCap Dividend Fund (DES) , down -4.84%
- ProShares Russell 2000 Dividend Growers ETF (SMDV), down -5.44%
- John Hancock Funds II Equity Income Fund (JIEMX) , down -7.53%
- Cullen High Dividend Equity Fund (CHDEX), down -9.33%
U.S. Fixed Income Strategies
In US fixed income, long duration bond focused strategies continued to post positive performances over the rolling month.
Winning
- ProShares Short 20+ Year Treasury (TBF) , up 2.44%
- American Beacon SiM High Yld Opps Fund (SHOYX), up 1.12%
- Franklin Floating Rate Daily Access Fund (FCFRX) , up 1.03%
- ProShares Investment Grade—Interest Rate Hedged (IGHG), up 1.02%
Losing
- SPDR® Portfolio Long Term Treasury ETF (SPTL) , down -3.05%
- iShares 20+ Year Treasury Bond ETF (TLT), down -3.75%
- PIMCO Extended Duration Fund (PEDPX) , down -6.22%
- Vanguard Extended Duration Treasury Index Fund (VEDIX), down -6.9%
Foreign Equity Strategies
Among foreign equities, Japanese and Indian strategies outperformed Taiwanese and South Korean counterparts for the rolling month.
Winning
- iShares MSCI Japan ETF (EWJ) , up 3.28%
- T. Rowe Price Japan Fund (RJAIX), up 2.58%
- WisdomTree India Earnings Fund (EPI) , up 1.73%
- Vanguard International Dividend Appreciation Index Fund (VIAAX), up 1.04%
Losing
- John Hancock Disciplined Value International Fund (JDISX) , down -8.03%
- iShares MSCI South Korea ETF (EWY), down -10.48%
- MFS International Intrinsic Value Fund (MGIAX) , down -12.15%
- iShares MSCI Taiwan ETF (EWT), down -14.34%
Foreign Fixed Income Strategies
Emerging market debt strategies were the only ones to post positive performances in the foreign fixed income space.
Winning
- Eaton Vance Emerging Markets Debt Opportunities Fund (EIDOX) , up 0.53%
- VanEck Emerging Markets High Yield Bond ETF (HYEM), up 0.38%
Losing
- Ashmore Emerging Markets Total Return Fund (EMKIX) , down -0.2%
- SPDR® Bloomberg Barclays Emerging Markets Local Bond ETF (EBND), down -0.95%
- PIMCO International Bond Fund Unhedged (PFUNX) , down -1.83%
- SPDR® Bloomberg Barclays International Treasury Bond ETF (BWX), down -1.84%
- Stone Harbor Emerging Markets Debt Fund (SHMDX) , down -2.2%
- iShares International Treasury Bond ETF (IGOV), down -2.26%
Alternatives
Among alternatives, hedged Japanese equity and minimum volatility strategies posted strong results over the rolling month, while commodities continued to struggle.
Winning
- ETFMG Alternative Harvest ETF (MJ) , up 13.07%
- iShares Currency Hedged MSCI Japan ETF (HEWJ), up 7.23%
- Vanguard Global Minimum Volatility Fund (VMNVX) , up 2.51%
- Fidelity® Contrafund® Fund (FCNKX), up 1.87%
Losing
- SPDR® S&P Global Natural Resources ETF (GNR) , down -5.86%
- iShares GSCI Commodity Dynamic Roll Strategy ETF (COMT), down -6.47%
- Fidelity® Select Gold Portfolio (FSAGX) , down -8.52%
- Swan Defined Risk Fund (SDRIX), down -11.3%
Sectors
Among the sectors healthcare strategies, especially those focused on biotechnology and cannabis, continue to post strong results, while strategies focused on palladium and precious metrals were in red.
Winning
- AdvisorShares Pure US Cannabis ETF (MSOS) , up 31.92%
- Fidelity Advisor® Biotechnology Fund (FBTAX), up 10.09%
- Franklin Biotechnology Discovery Fund (FTDZX) , up 8.6%
- SPDR® S&P Biotech ETF (XBI), up 4.72%
Losing
- American Beacon ARK Transformational Innovation Fund (ADNYX) , down -9.84%
- Franklin Gold and Precious Metals Fund (FGPMX), down -10.48%
- Invesco WilderHill Clean Energy ETF (PBW) , down -18.2%
- Aberdeen Standard Physical Palladium Shares ETF (PALL), down -22.29%
Methodology
Every week, MutualFunds.com provides a snapshot of the performance of some key mutual funds and ETFs to highlight the trending investment strategies across different sectors, geographic regions, asset classes and themes. MutualFunds.com uses a proprietary system to scan through thousands of relevant mutual funds and ETFs. Fund performance data is calculated for the trailing one month, based on the change in NAV.
Here is a summary of the different strategies covered in this article:
- U.S. equity strategies typically cover different equity investing styles (growth/value/blend) and market capitalizations (small/mid/large).
- Dividend strategies focus on generating income via different equity routes (high yield/dividend growth/foreign dividend/quality dividend)
- U.S. fixed income strategies focus on debt securities issued by U.S. entities and can cover different types of debt (corporate/municipal/high-yield/investment-grade/government/asset-backed) and maturity profiles (short/medium/long).
- Foreign equity strategies cover equity strategies applied to non-U.S. markets based on the level of economic growth (emerging/developed), regions (Asia/Europe/Africa), and market capitalizations (small/mid/large).
- Foreign fixed-income strategies focus on debt securities issued outside the U.S. markets and can cover different regions (Asia/Europe/Africa) and regions based on the level of economic development (emerging/developed).
- Alternative strategies cover non-traditional investments (currencies, hedge funds strategies, derivatives, volatility-based), real estate, and commodities.
- Sector strategies cover dedicated exposure to various sectors of the U.S. economy including technology, healthcare, financial, and industrial among others.


