Last week again showed the power of economic data and its effect on the markets.
Overall, the week was volatile as data continued to show a robust economy and potential for continued interest rate hikes. Kicking into gear the market’s downswing on the week was surging retail sales, which clocked in at 0.7% for July. The number beat both last month’s reading and estimates by a wide margin. Surprisingly, the housing market also showed strength, with both building permits and housing starts beating estimates and the previous month’s readings. Despite higher mortgage costs, consumers continue to buy homes at a record pace. The latest FOMC meeting minutes also added to the dour outlook on the week, with the Fed providing no definitive outlook on its path of interest rate hikes. The U.S. central bank continued to indicate that it would monitor data and would stay flexible in its approach to raising rates. With more hikes potentially ahead, the yield on the 10-year U.S. Treasury reached 4.3% at one point last week, the highest level seen since 2007.
Next week, the dog days of summer are officially here and economic data releases and earnings news should be light. The biggest data release will be month-over-month durable goods orders. Last month, declines in inflation sent orders for large capital goods surging 4.7%, the most since the pandemic. Analysts now predict that the increase in borrowing costs should only boost the metric by 0.5% for July when it is released on Thursday. Likewise, on Tuesday the Richmond Manufacturing Index is expected to show a -6 reading, indicating a slowdown in activity in the region. Elsewhere, investors will once again be focused on the latest weekly jobless claims on Thursday. Claims have started to move higher, however they still indicate a tight and strong labor market. This has boosted consumer attitudes as evident by a surging University of Michigan Consumer Sentiment report, which showed preliminary figures hitting 71.2 on August 11. On Friday, analysts expect the final number for August to stay the same.
Given this economic backdrop, let us see how this impacts the performance of various investment strategies.
Investment Strategy Scorecard
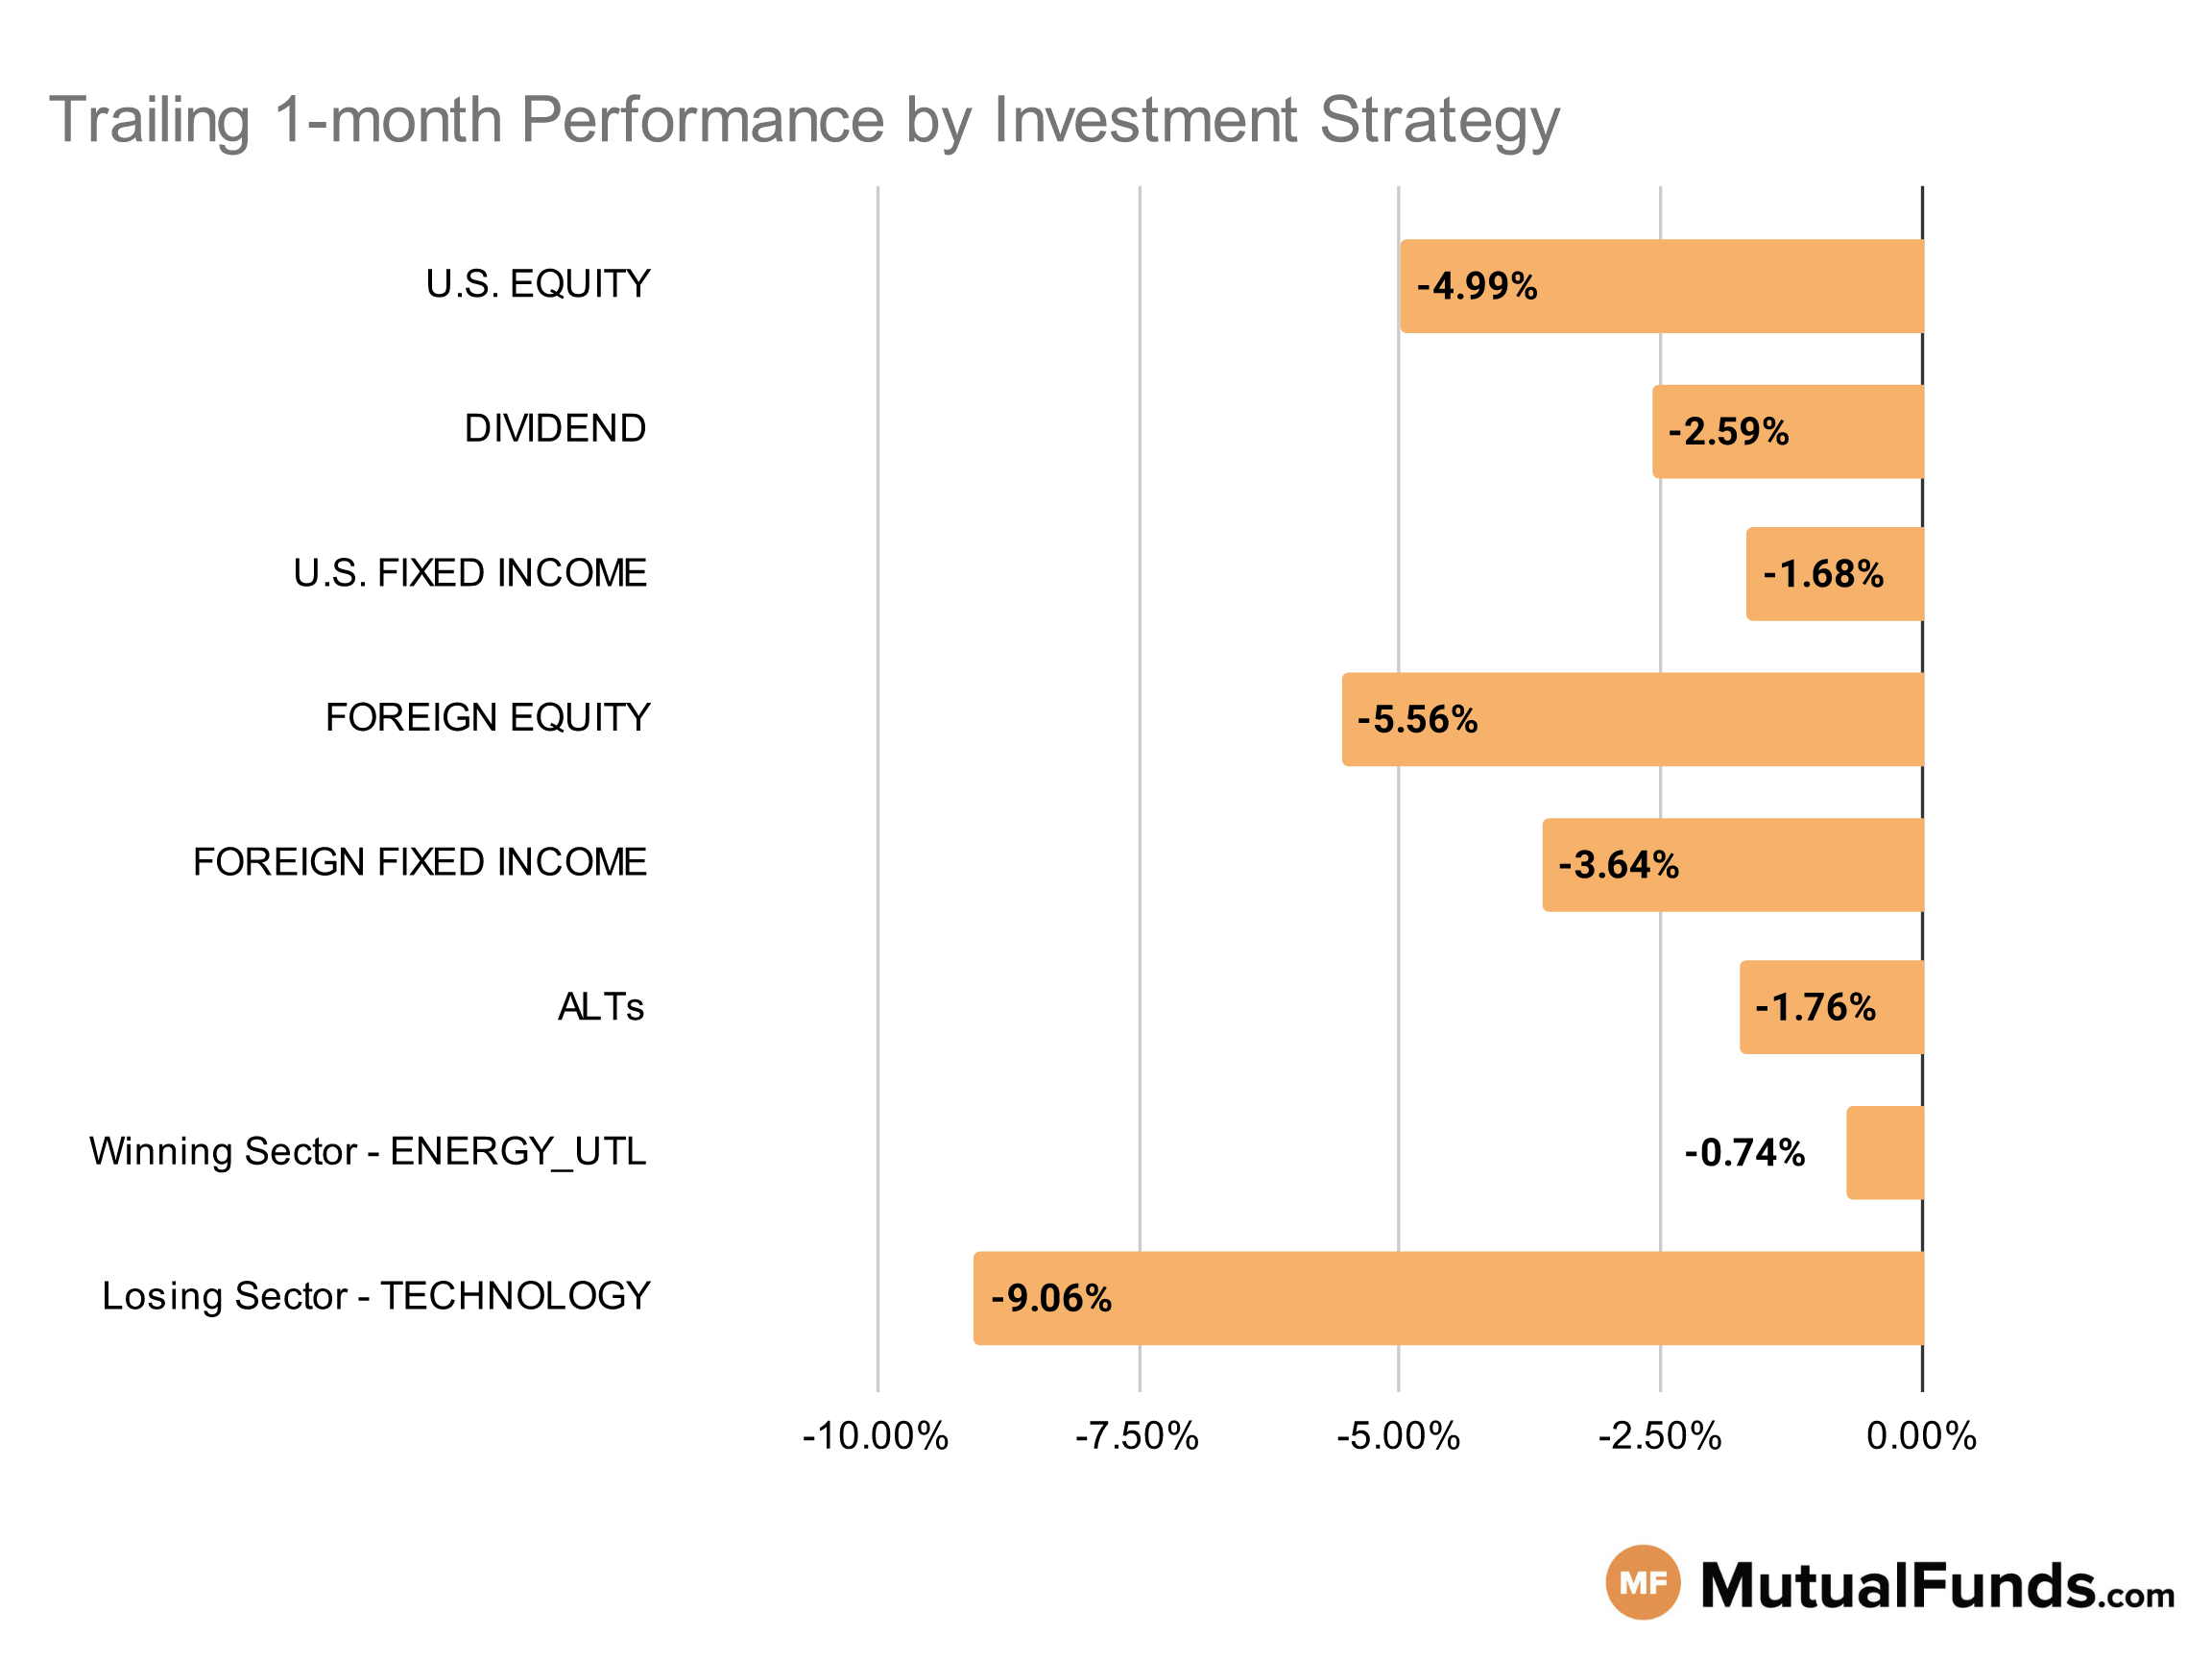
Overall, the markets were down this week.
Energy and high dividend strategies managed to perfor better than others, over the last trailing month. Meanwhile, gold, growth and long duration bond strategies struggled.
U.S Equity Strategies
None of the key U.S. equity strategies posted positive performance over the last trailing month. However, value strategies posted minimal loss, while growth strategies struggled.
Losing
- Bridgeway Omni Small-Cap Value Fund (BOSVX) , down -0.38%
- BNY Mellon Dynamic Value Fund (DRGVX), down -0.39%
- Schwab U.S. Large-Cap Value ETF™ (SCHV) , down -1.78%
- Schwab Fundamental U.S. Large Company Index ETF (FNDX), down -2.44%
- iShares Russell 2000 Growth ETF (IWO) , down -8.37%
- First Trust US Equity Opportunities ETF (FPX), down -11.37%
- Lazard US Equity Concentrated Portfolio (LEVOX) , down -15.06%
- Morgan Stanley Institutional Fund, Inc. Growth Portfolio (MSEGX), down -16.75%
Dividend Strategies
When it comes to dividend income, several high yielding strategies emerged as winners over the last trailing month while international strategies lost ground.
Winning
- Invesco High Yield Equity Dividend Achievers™ ETF (PEY) , up 3.21%
- iShares Core High Dividend ETF (HDV), up 1.79%
Losing
- DWS CROCI Equity Dividend Fd (KDHSX) , down -0.55%
- Vanguard Equity Income Fund (VEIRX), down -0.96%
- SPDR® S&P International Dividend ETF (DWX) , down -4.81%
- BlackRock Equity Dividend Fund (MKDVX), down -5.68%
- First Trust Dow Jones Global Select Dividend Index Fund (FGD) , down -6.1%
- HCM Dividend Sector Plus Fund (HCMNX), down -7.49%
U.S. Fixed Income Strategies
In US fixed income, floating rate strategies managed to post marginal gains, while longer duration bond strategies suffered big losses.
Winning
- ProShares Short 20+ Year Treasury (TBF) , up 9.11%
- Invesco Senior Floating Rate Fund (OOSAX), up 0.61%
- iShares Floating Rate Bond ETF (FLOT) , up 0.6%
- City National Rochdale Fixed Income Opportunities Fund (RIMOX), up 0.47%
Losing
- SPDR® Portfolio Long Term Treasury ETF (SPTL) , down -7.49%
- iShares 20+ Year Treasury Bond ETF (TLT), down -8.21%
- Vanguard Extended Duration Treasury Index Fund (VEDIX) , down -11.13%
- PIMCO Extended Duration Fund (PEDPX), down -11.24%
Foreign Equity Strategies
None of the key foreign equity strategies posted positive performance over the last trailing month. However, Indian equity strategies posted minimal loss, while South Korean and Swedish equity strategies suffered bigger losses.
Losing
- WisdomTree India Earnings Fund (EPI) , down -1.17%
- Horizon Kinetics Inflation Beneficiaries ETF (INFL), down -1.7%
- State Street Hedged International Developed Equity Index Fund (SSHQX) , down -1.9%
- PIMCO RAE Emerging Markets Fund (PEIFX), down -2.04%
- iShares MSCI South Korea ETF (EWY) , down -9.68%
- iShares MSCI Sweden ETF (EWD), down -10.95%
- Lord Abbett Developing Growth Fund (LADVX) , down -13%
Foreign Fixed Income Strategies
None of the key foreign debt strategies posted positive results over the last trailing month. However, emerging market debt strategies performed better than international treasury strategies in terms of minimizing losses.
Losing
- Eaton Vance Emerging Markets Debt Opportunities Fund (EIDOX) , down -1.06%
- VanEck Emerging Markets High Yield Bond ETF (HYEM), down -2.19%
- DFA World ex U.S. Government Fixed Income Portfolio (DWFIX) , down -2.26%
- iShares J.P. Morgan USD Emerging Markets Bond ETF (EMB), down -3.78%
- PIMCO International Bond Fund Unhedged (PFUNX) , down -5.06%
- Eaton Vance Emerging Markets Local Income Fund (EEIIX), down -5.14%
- SPDR® Bloomberg Barclays International Treasury Bond ETF (BWX) , down -5.61%
- iShares International Treasury Bond ETF (IGOV), down -5.67%
Alternatives
Among alternatives, several mangaed futures and commodity focused strategies continued their winning streak over the last month, while gold strategies suffered big losses.
Winning
- AQR Managed Futures Strategy Fund (AQMIX) , up 4.37%
- Catalyst/Millburn Hedge Strategy Fund (MBXAX), up 4.07%
- iShares S&P GSCI Commodity-Indexed Trust (GSG) , up 2.88%
- iShares GSCI Commodity Dynamic Roll Strategy ETF (COMT), up 2.17%
Losing
- Invesco S&P MidCap Low Volatility ETF (XMLV) , down -4.01%
- SPDR® Bloomberg Barclays Convertible Securities ETF (CWB), down -4.2%
- BlackRock Commodity Strategies Portfolio (BCSAX) , down -8.77%
- Fidelity® Select Gold Portfolio (FSAGX), down -13.8%
Sectors
Among the sectors, broader energy strategies posted solid performances over the last trailing month. However,strategies focused on clean energy and gold suffered.
Winning
- ProShares Short QQQ (PSQ) , up 8.18%
- Fidelity® Select Energy Portfolio (FSENX), up 7.48%
- Fidelity® MSCI Energy Index ETF (FENY) , up 7.28%
- Vanguard Energy Index Fund (VENAX), up 7.18%
Losing
- Sprott Gold Equity Fund (SGDLX) , down -14.65%
- American Beacon ARK Transformational Innovation Fund (ADNYX), down -18.87%
- First Trust NASDAQ® Clean Edge® Green Energy Index Fund (QCLN) , down -20.02%
- Invesco Solar ETF (TAN), down -21.43%
Methodology
Every week, MutualFunds.com provides a snapshot of the performance of some key mutual funds and ETFs to highlight the trending investment strategies across different sectors, geographic regions, asset classes and themes. MutualFunds.com uses a proprietary system to scan through thousands of relevant mutual funds and ETFs. To ensure quality and an adequate track record, the system places a minimum threshold on net assets of $100 million. Fund performance data is calculated for the trailing one month, based on the change in NAV.
Here is a summary of the different strategies covered in this article:
- U.S. equity strategies typically cover different equity investing styles (growth/value/blend) and market capitalizations (small/mid/large).
- Dividend strategies focus on generating income via different equity routes (high yield/dividend growth/foreign dividend/quality dividend)
- U.S. fixed income strategies focus on debt securities issued by U.S. entities and can cover different types of debt (corporate/municipal/high-yield/investment-grade/government/asset-backed) and maturity profiles (short/medium/long).
- Foreign equity strategies cover equity strategies applied to non-U.S. markets based on the level of economic growth (emerging/developed), regions (Asia/Europe/Africa), and market capitalizations (small/mid/large).
- Foreign fixed income strategies focus on debt securities issued outside the U.S. markets and can cover different regions (Asia/Europe/Africa) and regions based on the level of economic development (emerging/developed).
- Alternative strategies cover non-traditional investments (currencies, hedge funds strategies, derivatives, volatility-based), real estate, and commodities.
- Sector strategies cover dedicated exposure to various sectors of the U.S. economy including technology, healthcare, financial, and industrial among others.


