
The first trading week of August was a hard one for investors to swallow, with credit rating agency Fitch cutting the U.S. debt rating by one notch, from AAA to AA+.
Fitch cited the debt ceiling crisis as the reason for the downgrade. This follows S&P’s downgrade of U.S. debt back in 2011. As expected, the move sent stocks lower, with the NASDAQ posting its worst performance since February. However, investors largely took the move in stride and continued to buy bonds and stocks by the end of the week on mixed data and decent earnings numbers. Several tech names posted better-than-expected results, boosting growth stocks. In terms of data, the JOLTS report showed a slight decrease in the number of available jobs, while the ISM Manufacturing PMI slipped to 46.4, below forecasts and indicating a contraction. Likewise, the ISM Services PMI also slipped on the month, yet it still showed an expansionary trend. The unemployment rate dipped to 3.5% in July from 3.6% reported for June, with non-farm payroll jobs figures staying strong.
Heading into the dog days of summer, investors will focus on the market’s consistent issue– inflation. The latest Consumer Price Index (CPI) figures will be released next Thursday. After rising 0.2% last month, below estimates, analysts expect a similar increase for July. This would put the year-over-year annual inflation increase at 2.8%— close to the Fed’s target and indicating that the rate hikes are working to cool the economy. On Friday, producer prices are expected to rise by 0.2% month-over-month for July. Consumers seem bullish on the improved inflationary picture as well. Last month, the University of Michigan consumer sentiment report hit highs not seen since October of 2021 and analysts expect similar results from August’s preliminary reading on Friday. However, housing continues to be a mess, with a variety of MBA Mortgage data set to be released on Wednesday and Thursday. From mortgage applications to refinancing, many of the numbers point to much lower figures, showing that rate hikes are hitting the housing sector hard.
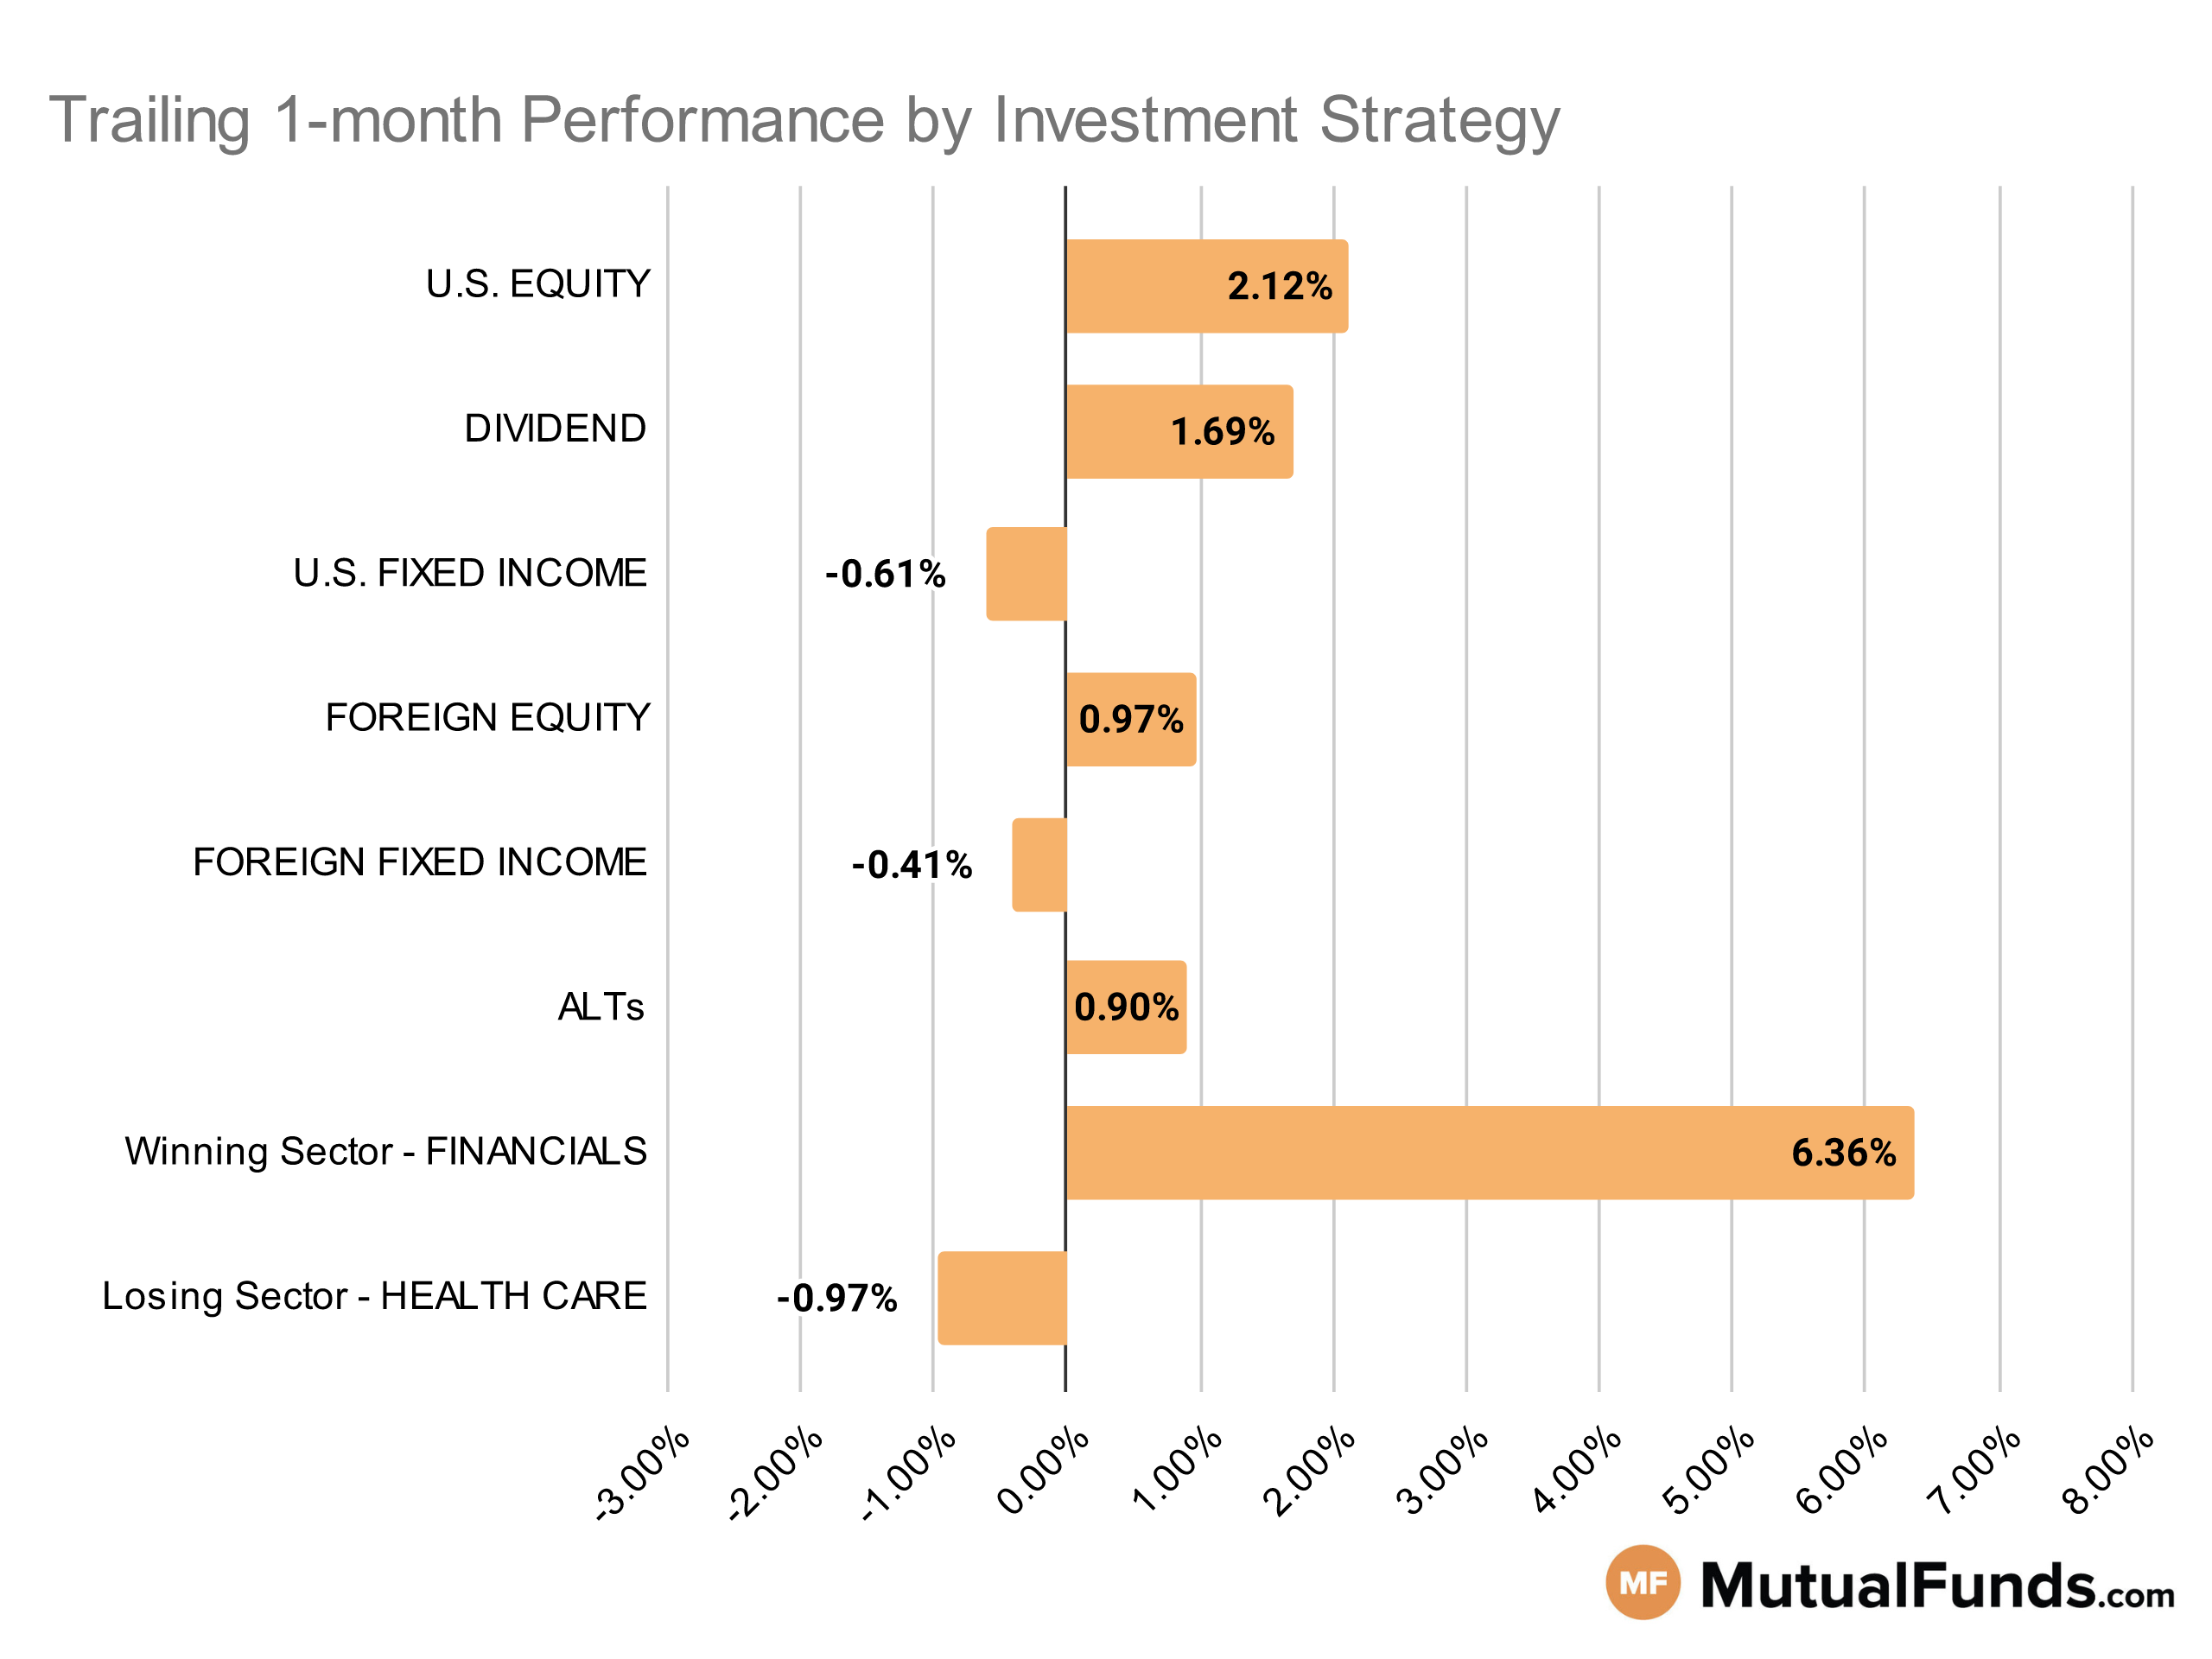
Given this economic backdrop, let us see how this impacts the performance of various investment strategies.
Investment Strategy Scorecard
High yield muni, energy and regional banking strategies performed well over the last trailing month. Meanwhile, longer duration bond strategies continued to struggle.
U.S Equity Strategies
In U.S. equities, value strategies continue to perform better than some growth strategies.
Winning
- Undiscovered Managers Behavioral Value Fund (UBVLX) , up 9.21%
- Bridgeway Omni Small-Cap Value Fund (BOSVX), up 8.91%
- Dimensional U.S. Targeted Value ETF (DFAT) , up 6.24%
- iShares Russell 2000 Value ETF (IWN), up 6.09%
Losing
- Voya U.S. Stock Index Portfolio (INGIX) , down -7.98%
- Voya Index Solution 2045 Portfolio (ISVLX), down -8.06%
Dividend Strategies
When it comes to dividend income, small and mid-cap focussed strategies came up on top while large-cap focussed strategies struggled.
Winning
- WisdomTree U.S. SmallCap Dividend Fund (DES) , up 5.87%
- ProShares Russell 2000 Dividend Growers ETF (SMDV), up 4.88%
- Principal Small-MidCap Dividend Income Fund (PMDIX) , up 4.21%
- Sterling Capital Equity Income Fund (BEGIX), up 3.72%
Losing
U.S. Fixed Income Strategies
In US fixed income, strategies focused on high yield munis and convertible debt posted positive results, while longer duration bond strategies continued to struggle.
Winning
- VanEck Vectors High Yield Muni ETF (HYD) , up 33.33%
- ProShares Short 20+ Year Treasury (TBF), up 6.75%
- Miller Convertible Bond Fund (MCIFX) , up 1.54%
- City National Rochdale Fixed Income Opportunities Fund (RIMOX), up 1%
Losing
- SPDR® Portfolio Long Term Treasury ETF (SPTL) , down -5.41%
- iShares 20+ Year Treasury Bond ETF (TLT), down -6.19%
- Vanguard Extended Duration Treasury Index Fund (VEDIX) , down -8.83%
- PIMCO Extended Duration Fund (PEDPX), down -8.97%
Foreign Equity Strategies
Among foreign equity strategies, emerging market strategies performed well, while Mexican and Saudi Arabian equity strategies lost ground.
Winning
- EMQQ The Emerging Markets Internet & Ecommerce ETF (EMQQ) , up 10.47%
- WisdomTree China ex-State-Owned Enterprises Fund (CXSE), up 9.58%
- Longleaf Partners International Fund (LLINX) , up 4.31%
- Baillie Gifford International Growth Fund (BGEUX), up 4.29%
Losing
- iShares MSCI Saudi Arabia ETF (KSA) , down -2.21%
- BNY Mellon International Stock Fund (DISYX), down -2.32%
- Wasatch International Growth Fund® (WAIGX) , down -2.73%
- iShares MSCI Mexico ETF (EWW), down -3.18%
Foreign Fixed Income Strategies
Among foreign debt, select international and emerging market debt strategies continue to post positive results.
Winning
- T. Rowe Price International Bond Fund (PAIBX) , up 0.43%
- Stone Harbor Emerging Markets Debt Fund (SHMDX), up 0.43%
Losing
- VanEck Emerging Markets High Yield Bond ETF (HYEM) , down -0.28%
- SPDR® Bloomberg Barclays International Treasury Bond ETF (BWX), down -0.4%
- VanEck J.P. Morgan EM Local Currency Bond ETF (EMLC) , down -1.02%
- Ashmore Emerging Markets Total Return Fund (EMKIX), down -1.04%
- SPDR® Bloomberg Barclays Emerging Markets Local Bond ETF (EBND) , down -1.09%
- Eaton Vance Emerging Markets Local Income Fund (EEIIX), down -1.39%
Alternatives
Among alternatives, commodity focused strategies continued their winning streak over the last month. On the other end, strategies focused on managed futures and preferred stocks struggled.
Winning
- iShares S&P GSCI Commodity-Indexed Trust (GSG) , up 8.57%
- iShares GSCI Commodity Dynamic Roll Strategy ETF (COMT), up 7.48%
- PIMCO CommoditiesPLUS® Strategy Fund (PCLAX) , up 7.32%
- Invesco Balanced-Risk Commodity Strategy Fund (BRCCX), up 4.64%
Losing
- Invesco Preferred ETF (PGX) , down -2.02%
- VanEck Preferred Securities ex Financials ETF (PFXF), down -2.28%
- BlackRock Commodity Strategies Portfolio (BCSAX) , down -4.06%
- PIMCO TRENDS Managed Futures Strategy Fund (PQTIX), down -4.85%
Sectors
Among the sectors, energy and regional banking strategies posted solid performances over the last trailing month. However, rare earth metals and utility equity strategies struggled.
Winning
- VanEck Oil Services ETF (OIH) , up 17.89%
- SPDR® S&P Regional Banking ETF (KRE), up 17.35%
- John Hancock Regional Bank Fund (FRBAX) , up 15.81%
- Fidelity® Select Energy Portfolio (FSENX), up 8.6%
Losing
- Fidelity® Select Utilities Portfolio (FSUTX) , down -2.86%
- MFS Utilities Fund (MMUFX), down -3.3%
- AdvisorShares Pure US Cannabis ETF (MSOS) , down -7.18%
- VanEck Rare Earth/Strategic Metals ETF (REMX), down -7.33%
Methodology
Every week, MutualFunds.com provides a snapshot of the performance of some key mutual funds and ETFs to highlight the trending investment strategies across different sectors, geographic regions, asset classes and themes. MutualFunds.com uses a proprietary system to scan through thousands of relevant mutual funds and ETFs. To ensure quality and an adequate track record, the system places a minimum threshold on net assets of $100 million. Fund performance data is calculated for the trailing one month, based on the change in NAV.
Here is a summary of the different strategies covered in this article:
- U.S. equity strategies typically cover different equity investing styles (growth/value/blend) and market capitalizations (small/mid/large).
- Dividend strategies focus on generating income via different equity routes (high yield/dividend growth/foreign dividend/quality dividend)
- U.S. fixed income strategies focus on debt securities issued by U.S. entities and can cover different types of debt (corporate/municipal/high-yield/investment-grade/government/asset-backed) and maturity profiles (short/medium/long).
- Foreign equity strategies cover equity strategies applied to non-U.S. markets based on the level of economic growth (emerging/developed), regions (Asia/Europe/Africa), and market capitalizations (small/mid/large).
- Foreign fixed income strategies focus on debt securities issued outside the U.S. markets and can cover different regions (Asia/Europe/Africa) and regions based on the level of economic development (emerging/developed).
- Alternative strategies cover non-traditional investments (currencies, hedge funds strategies, derivatives, volatility-based), real estate, and commodities.
- Sector strategies cover dedicated exposure to various sectors of the U.S. economy including technology, healthcare, financial, and industrial among others.


