
The last full trading week of July was all about the Fed, with the central bank releasing its latest FOMC meeting minutes and interest rate decision.
As expected, the Fed increased the Federal Funds ate by 0.25% to 5.25%-5.5%, bringing borrowing costs to the highest level since January 2001. Through its statement and chairman Jerome Powell’s press conferences, the Fed indicated its outlook will be based on incoming data, with the bank “prepared to adjust the stance of monetary policy as appropriate.” Investors took this as a sign that the Fed would pause or even cut in upcoming months. With that, the Dow Jones Industrial Average (DJIA) managed to go up for the 13th straight day, its longest winning streak since 1987. Other data on the week was bullish as well. The advance estimate of the U.S. second quarter real GDP growth rate came in at an annualized 2.4%, beating estimates of 1.8%. Month-over-month durable goods orders also surprised to the upside, locking in at 4.7% in June, more than double the market’s estimate. Personal spending and personal income data also showed positive gains, beating estimates and closing out the week of good data.
The new month will bring plenty of key data covering both manufacturing and employment, with both JOLTS and ISM Manufacturing PMI being reported on Tuesday. The ISM Manufacturing PMI slipped to 46 in June, below estimates and showing that the Fed’s interest rate hikes are affecting business spending. Analysts expect the number to hit 48 for July. The JOLTS report has stayed steady over the last few readings, continuing to indicate a robust labor market. Accordingly, the number of available jobs for June is expected to be around 9.5 million, compared to 9.8 million openings reported in May. Speaking of labor data, both the official unemployment rate and non-farm payrolls figures will be released on Friday. Economists predict a steady 3.6% unemployment rate. Meanwhile, an additional net 190,000 jobs are expected to be added to the economy in July – one of the lowest counts since the COVID-19 pandemic started. On the other hand, the ISM Services PMI continues to show healthy demand for services, unexpectedly jumping to 53.9 in June. Analysts expect the number to dip slightly to 52 when it is reported on Thursday.
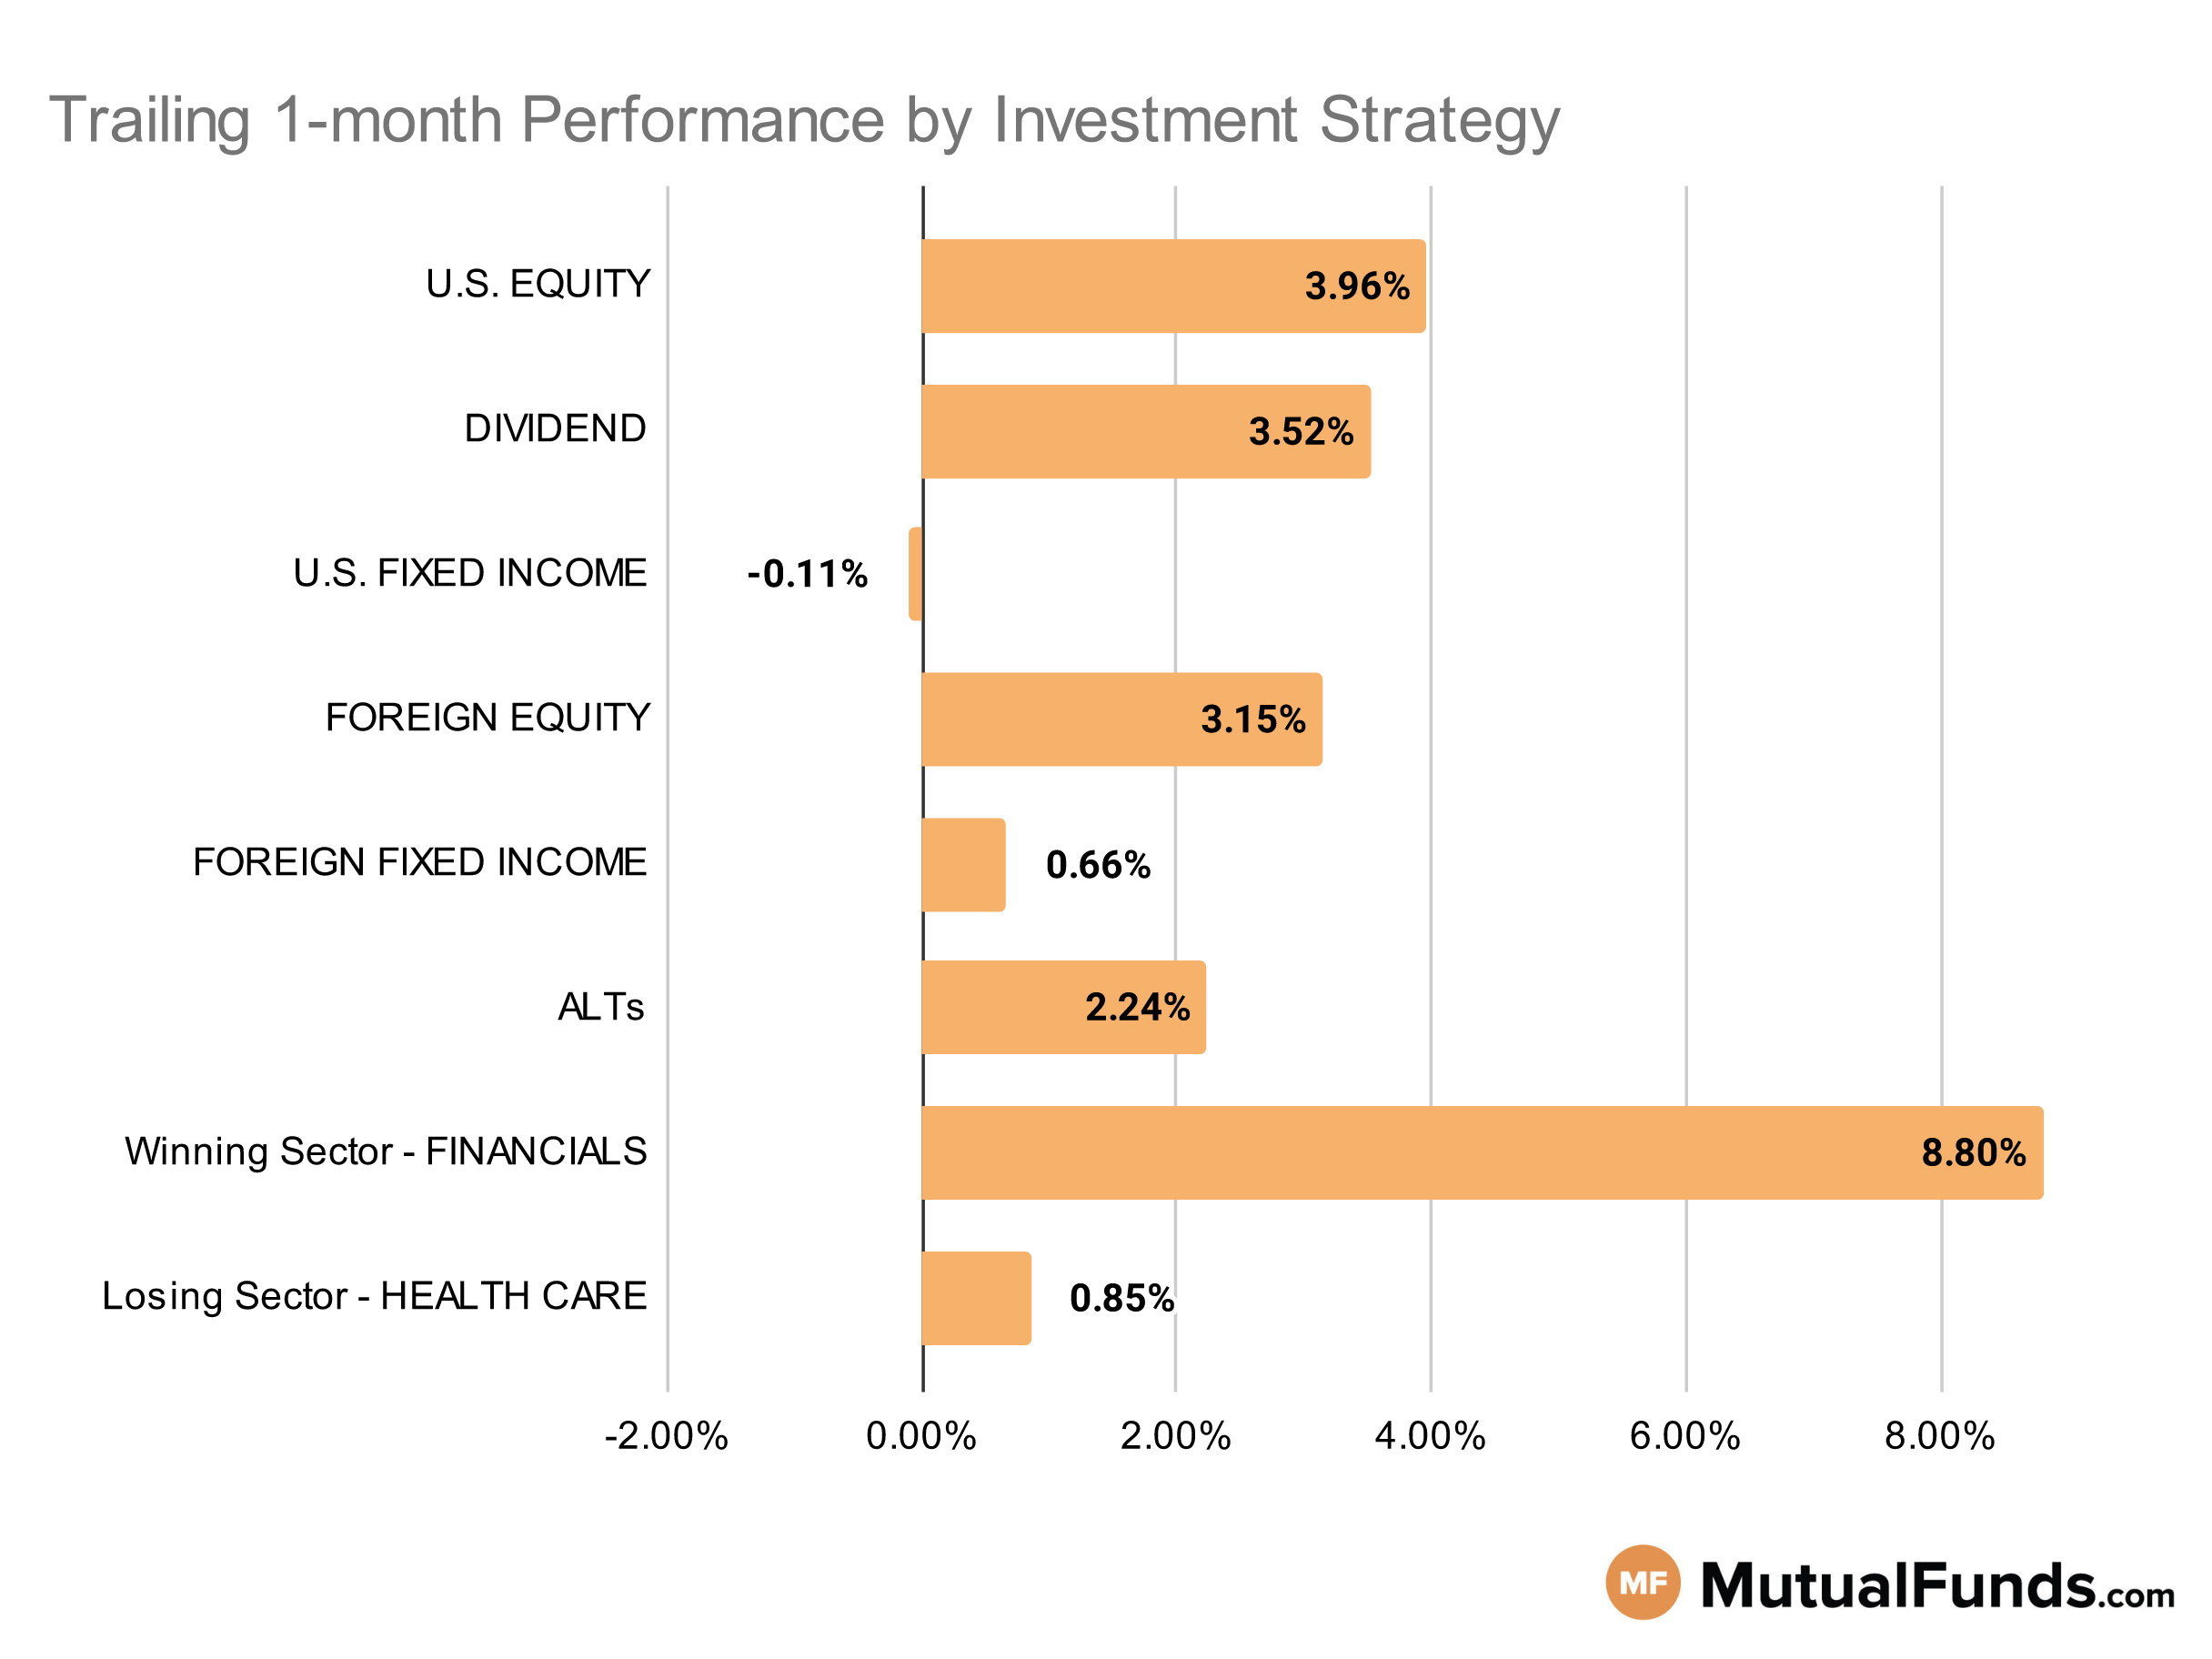
Given this economic backdrop, let us see how this impacts the performance of various investment strategies.
Investment Strategy Scorecard
Commodity and regional banking strategies performed well over the last trailing month. Meanwhile, longer duration bond strategies struggled.
U.S Equity Strategies
In U.S. equities, value strategies continue to perform better than some growth strategies.
Winning
- Vulcan Value Partners Small Cap Fund (VVISX) , up 10.68%
- Bridgeway Omni Small-Cap Value Fund (BOSVX), up 9.48%
- Dimensional U.S. Targeted Value ETF (DFAT) , up 7.21%
- iShares Russell 2000 Value ETF (IWN), up 6.89%
- Franklin LibertyQ U.S. Equity ETF (FLQL) , down 2.82%
- Invesco Dynamic Large Cap Growth ETF (PWB), down 2.19%
Losing
- Aberdeen US Equity II Fund (CCPCX) , down -0.08%
- Voya U.S. Stock Index Portfolio (INGIX), down -5.79%
Dividend Strategies
When it comes to dividend income, sector focussed and small/mid-cap strategies came up on top while global strategies continues to be on the losing end.
Winning
- Invesco S&P Ultra Dividend Revenue ETF (RDIV) , up 6.52%
- WisdomTree U.S. SmallCap Dividend Fund (DES), up 6.45%
- Principal Small-MidCap Dividend Income Fund (PMDIX) , up 5.5%
- HCM Dividend Sector Plus Fund (HCMNX), up 5.2%
- O’Shares U.S. Quality Dividend ETF (OUSA) , down 2.72%
- First Trust Value Line® Dividend Index Fund (FVD), down 2.57%
- Amana Mutual Funds Trust Income Fund (AMANX) , down 0.08%
Losing
- Janus Henderson Global Equity Income Fund (HFQAX), down -0.49%
U.S. Fixed Income Strategies
In US fixed income, strategies focused on convertible debt and shorting longer duration bonds posted positive results, while longer duration bond strategies continued to struggle.
Winning
- ProShares Short 20+ Year Treasury (TBF) , up 4.11%
- iShares Convertible Bond ETF (ICVT), up 2.64%
- Miller Convertible Bond Fund (MCIFX) , up 2.37%
- BlackRock Dynamic High Income Portfolio (BDHAX), up 1.85%
- SPDR® Portfolio Long Term Treasury ETF (SPTL) , down -3.4%
Losing
- iShares 20+ Year Treasury Bond ETF (TLT), down -3.75%
- PIMCO Extended Duration Fund (PEDPX) , down -4.83%
- Vanguard Extended Duration Treasury Index Fund (VEDIX), down -5.78%
Foreign Equity Strategies
Among foreign equity strategies, emerging market strategies performed well, while select international and Asian equity strategies lost ground.
Winning
- First Trust Emerging Markets AlphaDEX® Fund (FEM) , up 8.37%
- First Trust International Equity Opportunities ETF (FPXI), up 6.85%
- Longleaf Partners International Fund (LLINX) , up 6.47%
- PIMCO RAE Emerging Markets Fund (PEIFX), up 6.29%
- WisdomTree International Hedged Quality Dividend Growth Fund (IHDG) , down 1.34%
- iShares MSCI Taiwan ETF (EWT), down 1.33%
Losing
- Matthews Asian Growth and Income Fund (MACSX) , down -0.23%
- Invesco International Equity Fund (INEQX), down -1.86%
Foreign Fixed Income Strategies
Among foreign debt, several emerging market debt strategies continue to post positive results.On the other hand, select international Treasury and high-yield debt strategies from emerging markets suffered marginal losses.
Winning
- Stone Harbor Emerging Markets Debt Fund (SHMDX) , up 2.03%
- PIMCO Emerging Markets Local Currency and Bond Fund (PELPX), up 1.53%
- VanEck J.P. Morgan EM Local Currency Bond ETF (EMLC) , up 0.35%
- iShares J.P. Morgan USD Emerging Markets Bond ETF (EMB), up 0.22%
- DFA World ex U.S. Government Fixed Income Portfolio (DWFIX) , down 0.12%
Losing
- iShares International Treasury Bond ETF (IGOV), down -0.3%
- Janus Henderson Developed World Bond Fund (HFARX) , down -0.66%
- VanEck Emerging Markets High Yield Bond ETF (HYEM), down -0.66%
Alternatives
Among alternatives, commodity focused strategies emerged as winners over the last month. On the other end, strategies focused finding tactial opportunities and managed futures struggled.
Winning
- iShares S&P GSCI Commodity-Indexed Trust (GSG) , up 11.02%
- PIMCO CommoditiesPLUS® Strategy Fund (PCLAX), up 9.95%
- iShares GSCI Commodity Dynamic Roll Strategy ETF (COMT) , up 9.43%
- ALPS/CoreCommodity Management CompleteCommoditiesSM Strategy Fund (JCRAX), up 6.79%
Losing
- SPDR® DoubleLine Total Return Tactical ETF (TOTL) , down -1.06%
- Janus Henderson Mortgage-Backed Securities ETF (JMBS), down -1.26%
- AQR Managed Futures Strategy Fund (AQMIX) , down -2.16%
- BlackRock Tactical Opportunities Fund (PCBAX), down -3.92%
Sectors
Among the sectors, oil services and regional banking strategies posted solid performances over the last trailing month. However, palladium and healthcare equity strategies struggled.
Winning
- VanEck Oil Services ETF (OIH) , up 20.05%
- SPDR® S&P Regional Banking ETF (KRE), up 17.84%
- John Hancock Regional Bank Fund (FRBAX) , up 15.98%
- Davis Financial Fund (DVFYX), up 9.15%
Losing
- PGIM Jennison Health Sciences Fund (PHLAX) , down -1.48%
- Eventide Healthcare & Life Sciences Fund (ETAHX), down -1.81%
- Aberdeen Standard Physical Palladium Shares ETF (PALL) , down -5.09%
- AdvisorShares Pure US Cannabis ETF (MSOS), down -7.58%
Methodology
Every week, MutualFunds.com provides a snapshot of the performance of some key mutual funds and ETFs to highlight the trending investment strategies across different sectors, geographic regions, asset classes and themes. MutualFunds.com uses a proprietary system to scan through thousands of relevant mutual funds and ETFs. To ensure quality and an adequate track record, the system places a minimum threshold on net assets of $100 million. Fund performance data is calculated for the trailing one month, based on the change in NAV.
Here is a summary of the different strategies covered in this article:
- U.S. equity strategies typically cover different equity investing styles (growth/value/blend) and market capitalizations (small/mid/large).
- Dividend strategies focus on generating income via different equity routes (high yield/dividend growth/foreign dividend/quality dividend)
- U.S. fixed income strategies focus on debt securities issued by U.S. entities and can cover different types of debt (corporate/municipal/high-yield/investment-grade/government/asset-backed) and maturity profiles (short/medium/long).
- Foreign equity strategies cover equity strategies applied to non-U.S. markets based on the level of economic growth (emerging/developed), regions (Asia/Europe/Africa), and market capitalizations (small/mid/large).
- Foreign fixed income strategies focus on debt securities issued outside the U.S. markets and can cover different regions (Asia/Europe/Africa) and regions based on the level of economic development (emerging/developed).
- Alternative strategies cover non-traditional investments (currencies, hedge funds strategies, derivatives, volatility-based), real estate, and commodities.
- Sector strategies cover dedicated exposure to various sectors of the U.S. economy including technology, healthcare, financial, and industrial among others.


