
The tech sector provided resiliency with key names like Microsoft and Google reporting better-than-expected numbers. Analysts postulated that the various cost-cutting measures have been working. However, banking industry news made investors nervous as First Republic reported that it saw over $100 billion in consumer deposits leave the bank. This prompted fears and reports that the Fed may take the bank into receivership, overshadowing strong tech earnings and sending stocks lower on the week. Economic data released during the week provided a mixed backdrop. Month-over-month durable goods orders were a bright spot, jumping 3.2%. This beat analysts’ estimates, highlighting the positive impact of the declining inflation rate on the sale of heavy goods. However, the advanced real GDP growth rate painted a sluggish picture, with the economy growing by just 1.1% on an annual basis in Q1. This was less than the 2.6% recorded last quarter and the consensus of 2% among economists. Personal spending and income data was also lower for the month, with data indicating consumers are earning less than expected but are spending more.
Next week, the Fed will be in focus once again with its latest interest rate decision. During March’s FOMC meeting, policy makers observed that inflation was still too high and the labor market too tight. With that backdrop, members remarked that additional tightening of rates may be in order. Current FedWatch tools indicate that the majority of market participants expect that on Wednesday the Fed will raise rates to 5.25%, the highest level since before the Great Recession. In addition to the Fed’s rate decision, there will be plenty of additional data released during the week that will showcase just how much the Fed’s rate tightening is working. On Tuesday, we’ll get to see the latest JOLTS report, which is likely to show a declining trend in the number of available jobs. The metric is expected to fall to 9.7 million in March from 9.9 million reported in February. The official unemployment reading for April is likely to show a slight uptick to 3.6% when it is released on Friday. Also on the docket for next week is the ISM Manufacturing PMI report. The measure of manufacturing activity decreased to 46.3 in March, the lowest since May of 2020, and is expected to hover around a similar level in April when it is released on Monday. Any measure below 50 is considered in contraction. Likewise, the ISM Non-Manufacturing PMI is expected to fall, hovering just above the 50 mark.
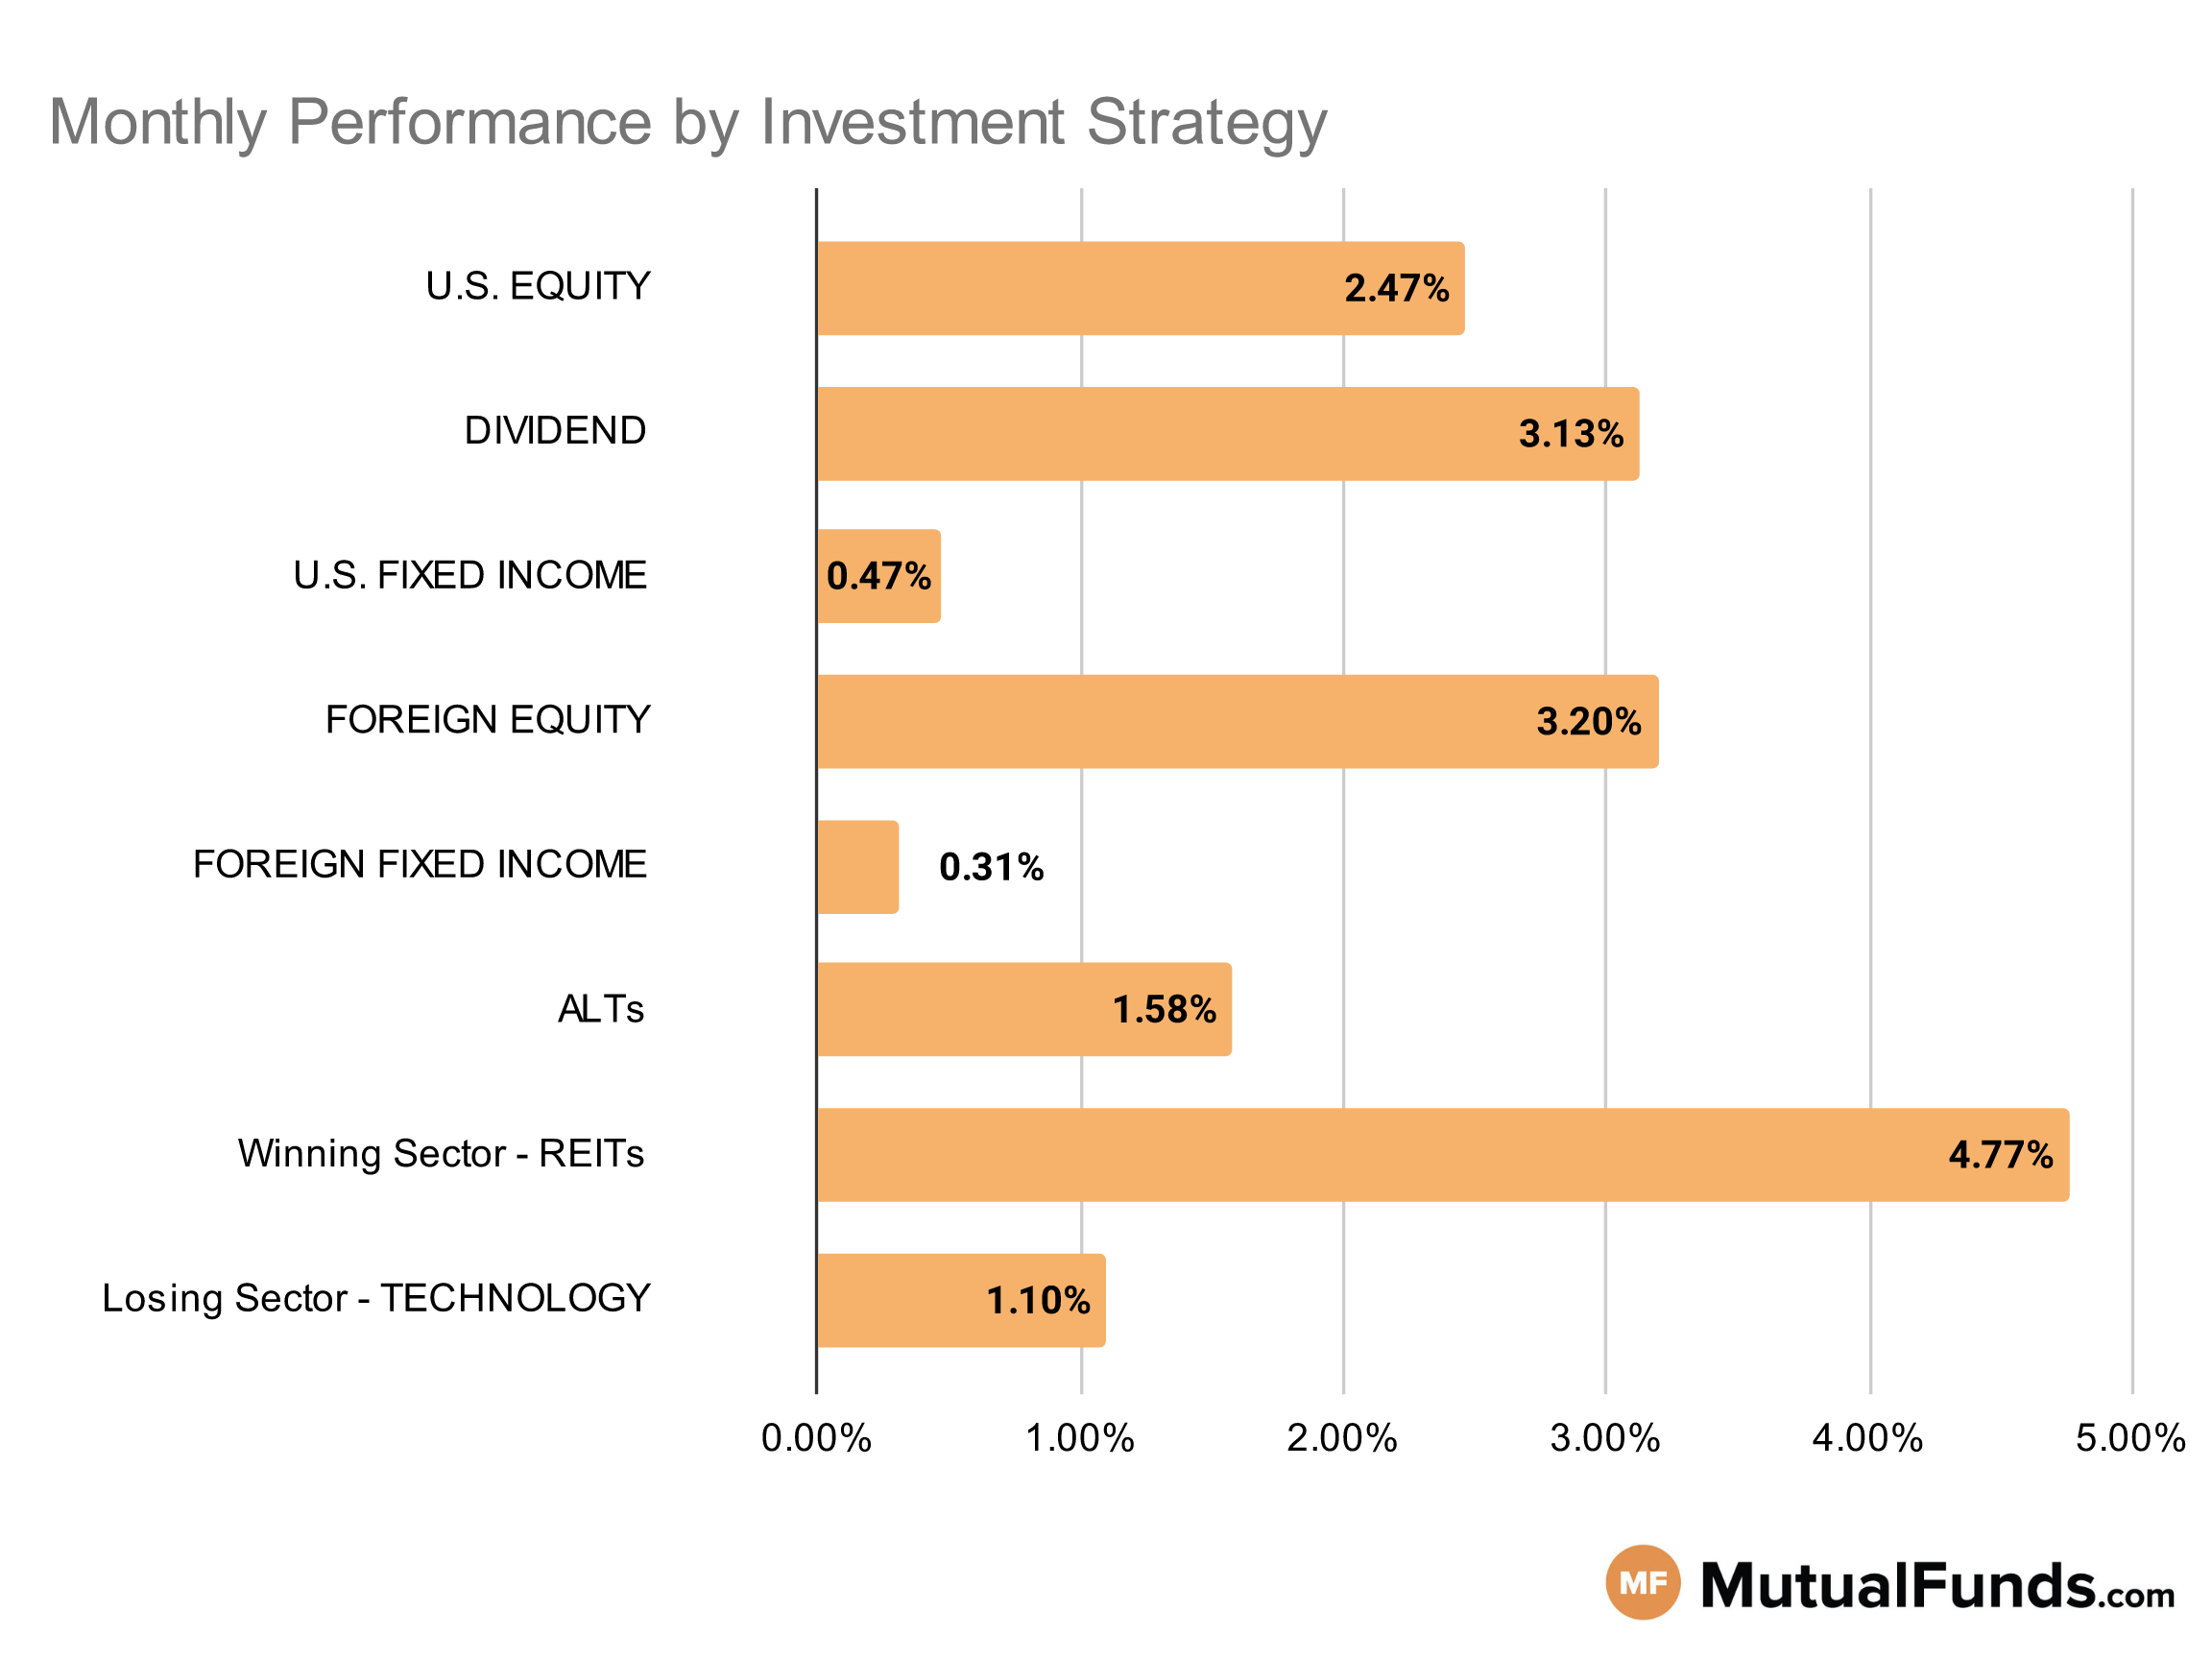
Given this economic backdrop, let us see how this impacts the performance of various investment strategies.
Investment Strategy Scorecard
US Broad mostly includes funds focused on US equities and can cover different investing styles (growth/value) and market capitalizations (small/mid/large). Fixed Income includes funds focused on debt securities and can cover different geographies (US/foreign) and security types (corporate/municipal/high-yield/investment-grade/government/structured). Alternatives cover funds focused on non-traditional investment strategies (currency, hedge fund strategy, derivatives), leveraged/structured products, real estate, and commodities. Dividend funds focus on generating income via equities and not through debt.
U.S Equity Strategies
In U.S. equities, large cap growth strategies outperformed others over the last one month. On the other hand, small and micro cap strategies lost.
Winning
- Ivy Large Cap Growth Fund (WLGAX) , up 6.3%
- Delaware Ivy Large Cap Growth Fund (WLGYX), up 6.28%
- Schwab U.S. Large-Cap Growth ETF™ (SCHG) , up 4.81%
- iShares Core S&P U.S. Value ETF (IUSV), up 4.21%
Losing
- iShares S&P Small-Cap 600 Growth ETF (IJT) , down -1.41%
- iShares Micro-Cap ETF (IWC), down -1.61%
- Bridgeway Omni Small-Cap Value Fund (BOSVX) , down -2.8%
- Artisan Small Cap Fund (APDSX), down -3.05%
Dividend Strategies
Here value focused dividend strategies won while small cap and growth focused dividend strategies lost during the last month.
Winning
- VALIC Company I Dividend Value Fund (VCIGX) , up 5.23%
- ClearBridge Dividend Strategy Fund (SOPYX), up 4.97%
- SPDR® S&P International Dividend ETF (DWX) , up 4.97%
- Fidelity® High Dividend ETF (FDVV), up 4.41%
Losing
- Principal Global Diversified Income Fund (PGBAX) , up 0.94%
- Matthews Asia Dividend Fund (MIPIX), down -0.37%
- WisdomTree U.S. SmallCap Dividend Fund (DES) , down -0.9%
- ProShares Russell 2000 Dividend Growers ETF (SMDV), down -2.42%
U.S. Fixed Income Strategies
Under U.S. fixed income, longer duration and high yielding strategies won while asset-backed fixed income strategies suffered.
Winning
- PIMCO StocksPLUS® Long Duration Fund (PSLDX) , up 5.27%
- BlackRock Dynamic High Income Portfolio (BDHAX), up 2.54%
- SPDR® Bloomberg Barclays High Yield Bond ETF (JNK) , up 2.28%
- iShares iBoxx $ High Yield Corporate Bond ETF (HYG), up 2.26%
Losing
- SPDR® Nuveen Bloomberg Barclays Short Term Municipal Bond ETF (SHM) , down -0.59%
- ProShares UltraShort 20+ Year Treasury (TBT), down -0.62%
- Thompson Bond Fund (THOPX) , down -1.12%
- AlphaCentric Income Opportunities Fund (IOFCX), down -1.49%
Foreign Equity Strategies
Among foreign equity strategies, Swedish and Swiss equities came out as the top performing strategies, while emerging market strategies including those focused on China lost.
Winning
- iShares MSCI Sweden ETF (EWD) , up 9.83%
- iShares MSCI Switzerland ETF (EWL), up 8.93%
- Oakmark International Small Cap Fund (OAZEX) , up 7.83%
- Oakmark International Fund (OANEX), up 7.77%
Losing
- PGIM Jennison Emerging Markets Equity Opportunities Fund (PDEZX) , down -3.44%
- Fidelity® China Region Fund (FHKCX), down -4.03%
- iShares Asia 50 ETF (AIA) , down -4.58%
- EMQQ The Emerging Markets Internet & Ecommerce ETF (EMQQ), down -5.72%
Foreign Fixed Income Strategies
While emerging market debt strategies performed well, treasury and government bond focused strategies lost.
Winning
- SEI Institutional Investments Trust Emerging Markets Debt Fund (SEDAX) , up 1.71%
- PIMCO Emerging Markets Local Currency and Bond Fund (PELPX), up 1.58%
- iShares J.P. Morgan USD Emerging Markets Bond ETF (EMB) , up 0.74%
- VanEck Emerging Markets High Yield Bond ETF (HYEM), up 0.33%
Losing
- Eaton Vance Emerging Markets Debt Opportunities Fund (EIDOX) , down -0.68%
- iShares International Treasury Bond ETF (IGOV), down -0.74%
- SPDR® Bloomberg Barclays International Treasury Bond ETF (BWX) , down -0.74%
- DFA World ex U.S. Government Fixed Income Portfolio (DWFIX), down -0.83%
Alternatives
Among alternative strategies, silver and volatility strategies expected to profit from decreases in expected volatility emerged as top performers. On the contrary broader commodity based strategies lost.
Winning
- ProShares Ultra Silver (AGQ) , up 12.8%
- ProShares Short VIX Short-Term Futures ETF (SVXY), up 8.5%
- Fidelity® Contrafund® Fund (FCNKX) , up 5.87%
- Columbia Contrarian Core Fund (SMGIX), up 4.96%
Losing
- DWS Enhanced Commodity Strategy Fund (SKSRX) , down -1.35%
- Credit Suisse Commodity Return Strategy Fund (CRSAX), down -1.59%
- ETFMG Alternative Harvest ETF (MJ) , down -5.13%
- ProShares Ultra VIX Short-Term Futures ETF (UVXY), down -23.37%
Sectors
While biotech strategies won over the last month, semiconductor and regional banking strategies pulled back.
Winning
- Direxion Daily S&P Biotech Bull 3X Shares (LABU) , up 14.04%
- Direxion Daily Financial Bull 3X Shares (FAS), up 11.96%
- Rydex NASDAQ-100® 2x Strategy Fund (RYVLX) , up 8.03%
- ProFunds UltraNASDAQ-100 Fund (UOPIX), up 8.02%
Losing
Methodology
Here is a summary of different strategies covered in this article:
- U.S. equity strategies typically cover different equity investing styles (growth/value/blend) and market capitalizations (small/mid/large).
- Dividend strategies focus on generating income via different equity routes (high yield/dividend growth/foreign dividend/quality dividend)
- U.S. fixed income strategies focus on debt securities issued by U.S. entities and can cover different types of debt (corporate/municipal/high-yield/investment-grade/government/asset-backed) and maturity profiles (short/medium/long).
- Foreign equity strategies cover equity strategies applied to non-U.S. markets based on the level of economic growth (emerging/developed), regions (Asia/Europe/Africa), and market capitalizations (small/mid/large).
- Foreign fixed income strategies focus on debt securities issued outside the U.S. markets and can cover different regions (Asia/Europe/Africa) and regions based on the level of economic development (emerging/developed).
- Alternative strategies cover non-traditional investments (currencies, hedge funds strategies, derivatives, volatility-based), real estate, and commodities.
- Sector strategies cover dedicated exposure to various sectors of the U.S. economy including technology, healthcare, financial, and industrial among others.


