
Stocks spent last week whipsawing as investors digested key pieces of inflation data.
The Federal Reserve’s favorite measure of inflation – the Core PCE Price Index – came in stronger than expected at 0.4% in January, versus previous readings of 0.1% and predictions of 0.3%. At first, investors took that to mean that the central bank will continue to keep rates steady or even potentially raise them once more. However, a slightly lower fourth quarter GDP growth of 3.2% helped reinforce the belief that the Federal Reserve might start to think of cutting interest rates instead. Adding to the conviction that the central bank might cut rates was a negative durable goods report, lower ISM manufacturing PMI reading and a lower consumer confidence metric. These data points sent stocks higher during the tail end of the week, propelling the NASDAQ to a new record high.
With the first full trading week of March, investors will get a break from the deluge of data, with only a few metrics being released. Much of that data will concentrate on the labor market. On Wednesday, we’ll get to see January’s JOLTS report, which surprised economists with last month’s reading. Analysts expect the number of job openings to clock in at 8.9 million in January, which although slightly down from December’s number of 9.03 million is still a robust figure and shows the strength of the labor economy. Also expected to produce bullish readings will be Friday’s official non-farm payroll number and official unemployment rate, which are predicted to clock in at 195,000 jobs and 3.7%, respectively in February. However, investors may not be too pleased with the bullishness on the jobs front. The Federal Reserve has continued to keep rates high and a strong labor market could indicate that the economy is still too strong to cut rates.
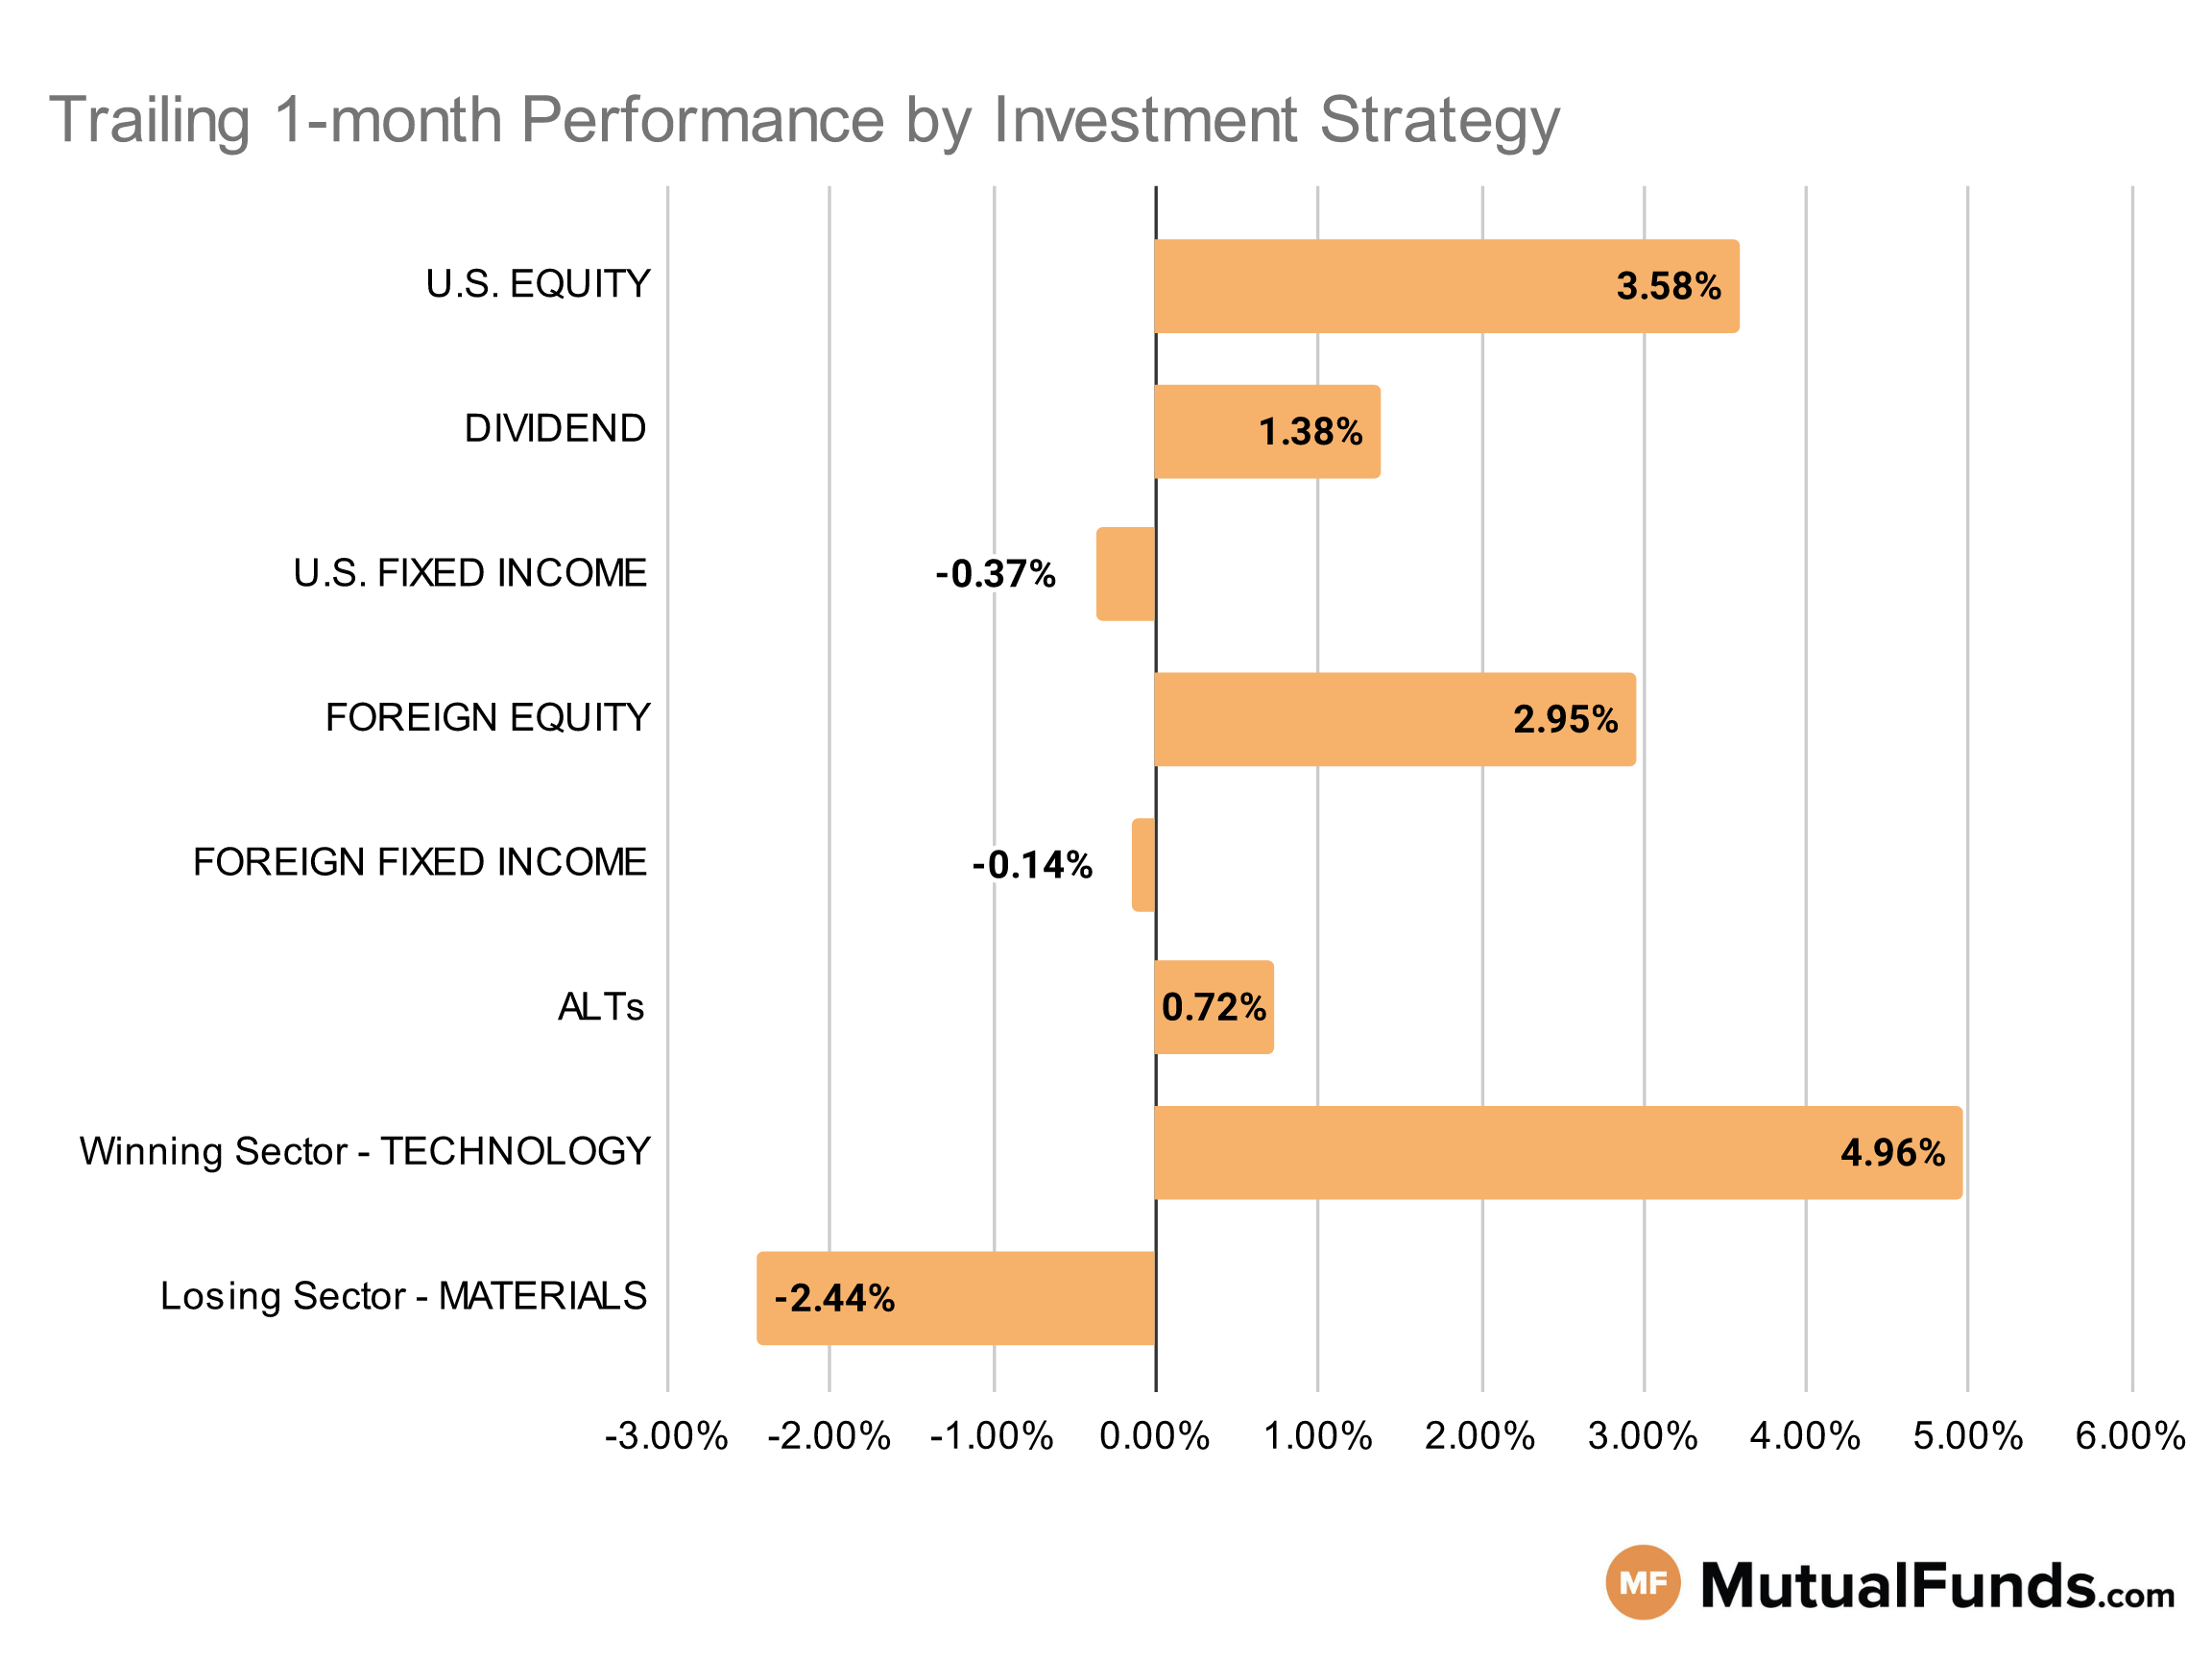
Given this economic backdrop, let us see how this impacts the performance of various investment strategies.
Investment Strategy Scorecard
Overall, the U.S. stock markets continue to be in the positive territory for the rolling month.
Real estate and growth-focused strategies, especially technology, posted solid results. Meanwhile, uranium and precious metals, including silver and gold, struggled over the rolling month.
U.S Equity Strategies
Overall, growth strategies continue to outperform value strategies.
Winning
- AB Discovery Growth Fund (CHCZX), up 10.78%
- JPMorgan Small Cap Growth Fund (PGSGX), up 9.27%
- iShares S&P Mid-Cap 400 Growth ETF (IJK), up 7.87%
- SPDR® S&P 400 Mid Cap Growth ETF (MDYG), up 7.86%
Losing
- iShares S&P Small-Cap 600 Value ETF (IJS), down -0.5%
- SPDR® S&P 600 Small Cap Value ETF (SLYV), down -0.54%
- Nuance Mid Cap Value Fund (NMAVX), down -1.22%
- Bridgeway Omni Small-Cap Value Fund (BOSVX), down -1.38%
Dividend Strategies
Several dividend growth-focused strategies posted positive performances over the rolling month, while high yield and small cap strategies continued to struggle.
Winning
- Fidelity® Dividend Growth Fund (FDGFX), up 4.42%
- Fidelity Advisor® Dividend Growth Fund (FDGTX), up 4.33%
- JPMorgan Diversified Return U.S. Equity ETF (JPUS), up 2.85%
- WisdomTree U.S. Quality Dividend Growth Fund (DGRW), up 2.65%
Losing
- Franklin Income Fund (FCISX), down -0.85%
- Federated Hermes Strategic Value Dividend Fund (SVAIX), down -1.46%
- ProShares Russell 2000 Dividend Growers ETF (SMDV), down -2.27%
- Invesco High Yield Equity Dividend Achievers™ ETF (PEY), down -4.13%
U.S. Fixed Income Strategies
In US fixed income, convertible bond strategies continued to post positive results, while some long term bond strategies struggled.
Winning
- ProShares Short 20+ Year Treasury (TBF), up 1.87%
- PIMCO StocksPLUS® Long Duration Fund (PSLDX), up 1.63%
- Miller Convertible Bond Fund (MCIFX), up 1.49%
- Invesco CEF Income Composite ETF (PCEF), up 1.25%
Losing
- Vanguard Long Term Investment Grade Fund (VWESX), down -2.5%
- iShares 10+ Year Investment Grade Corporate Bond ETF (IGLB), down -2.76%
- SPDR® Portfolio Long Term Corporate Bond ETF (SPLB), down -2.8%
- Vanguard Long-Term Corporate Bond Index Fund (VLTCX), down -3.06%
Foreign Equity Strategies
Among foreign equities, Asian equity strategies led the pack while international real estate and Switzerland equity strategies struggled over the rolling month.
Winning
- First Trust International Equity Opportunities ETF (FPXI), up 10.53%
- WisdomTree China ex-State-Owned Enterprises Fund (CXSE), up 8.36%
- Matthews Asia Growth Fund (MPACX), up 7.31%
- Lord Abbett Developing Growth Fund (LADVX), up 7.23%
Losing
- Wasatch International Growth Fund® (WAIGX), down -0.93%
- Columbia Overseas Value Fund (COSZX), down -1.81%
- iShares MSCI Switzerland ETF (EWL), down -2.82%
- SPDR® Dow Jones International Real Estate ETF (RWX), down -3.71%
Foreign Fixed Income Strategies
Emerging market debt strategies continue to outperform the developed market and globally diversified debt strategies.
Winning
- Eaton Vance Emerging Markets Debt Opportunities Fund (EIDOX), up 1.58%
- Stone Harbor Emerging Markets Debt Fund (SHMDX), up 1.27%
- VanEck Emerging Markets High Yield Bond ETF (HYEM), up 0.27%
- iShares J.P. Morgan USD Emerging Markets Bond ETF (EMB), up 0.18%
Losing
- VanEck J.P. Morgan EM Local Currency Bond ETF (EMLC), down -1.16%
- SPDR® Bloomberg Barclays International Treasury Bond ETF (BWX), down -1.25%
- Templeton Global Bond Fund (TGBAX), down -1.61%
- Janus Henderson Developed World Bond Fund (HFARX), down -1.68%
Alternatives
Among alternatives, hedged Japanese and managed futures strategies posted strong results over the rolling month, while gold strategies remained in the red.
Winning
- WisdomTree Japan Hedged Equity Fund (DXJ), up 8%
- AQR Managed Futures Strategy Fund (AQMIX), up 7.61%
- Fidelity® Contrafund® Fund (FCNKX), up 7.25%
- iShares Currency Hedged MSCI Japan ETF (HEWJ), up 6.92%
Losing
- Victory Market Neutral Income Fund (CBHAX), down -2.32%
- Invesco DB Commodity Index Tracking Fund (DBC), down -2.57%
- Fidelity® Select Gold Portfolio (FSAGX), down -6.68%
- ETFMG Alternative Harvest ETF (MJ), down -7.36%
Sectors
Among the sectors real estate and technology strategies posted strong results, while strategies focused on precious metals continue to be in red.
Winning
- iShares Mortgage Real Estate Capped ETF (REM), up 50%
- Amplify Transformational Data Sharing ETF (BLOK), up 22.22%
- Fidelity® Select Semiconductors Portfolio (FSELX), up 12.65%
- Fidelity Advisor® Semiconductors Fund (FIKGX), up 12.46%
Losing
- John Hancock Regional Bank Fund (FRBAX), down -6.88%
- Franklin Gold and Precious Metals Fund (FGPMX), down -8.92%
- Global X Uranium ETF (URA), down -10.11%
- Global X Silver Miners ETF (SIL), down -10.43%
Methodology
Every week, MutualFunds.com provides a snapshot of the performance of some key mutual funds and ETFs to highlight the trending investment strategies across different sectors, geographic regions, asset classes and themes. MutualFunds.com uses a proprietary system to scan through thousands of relevant mutual funds and ETFs. Fund performance data is calculated for the trailing one month, based on the change in NAV.
Here is a summary of the different strategies covered in this article:
- U.S. equity strategies typically cover different equity investing styles (growth/value/blend) and market capitalizations (small/mid/large).
- Dividend strategies focus on generating income via different equity routes (high yield/dividend growth/foreign dividend/quality dividend)
- U.S. fixed income strategies focus on debt securities issued by U.S. entities and can cover different types of debt (corporate/municipal/high-yield/investment-grade/government/asset-backed) and maturity profiles (short/medium/long).
- Foreign equity strategies cover equity strategies applied to non-U.S. markets based on the level of economic growth (emerging/developed), regions (Asia/Europe/Africa), and market capitalizations (small/mid/large).
- Foreign fixed-income strategies focus on debt securities issued outside the U.S. markets and can cover different regions (Asia/Europe/Africa) and regions based on the level of economic development (emerging/developed).
- Alternative strategies cover non-traditional investments (currencies, hedge funds strategies, derivatives, volatility-based), real estate, and commodities.
- Sector strategies cover dedicated exposure to various sectors of the U.S. economy including technology, healthcare, financial, and industrial among others.


