News
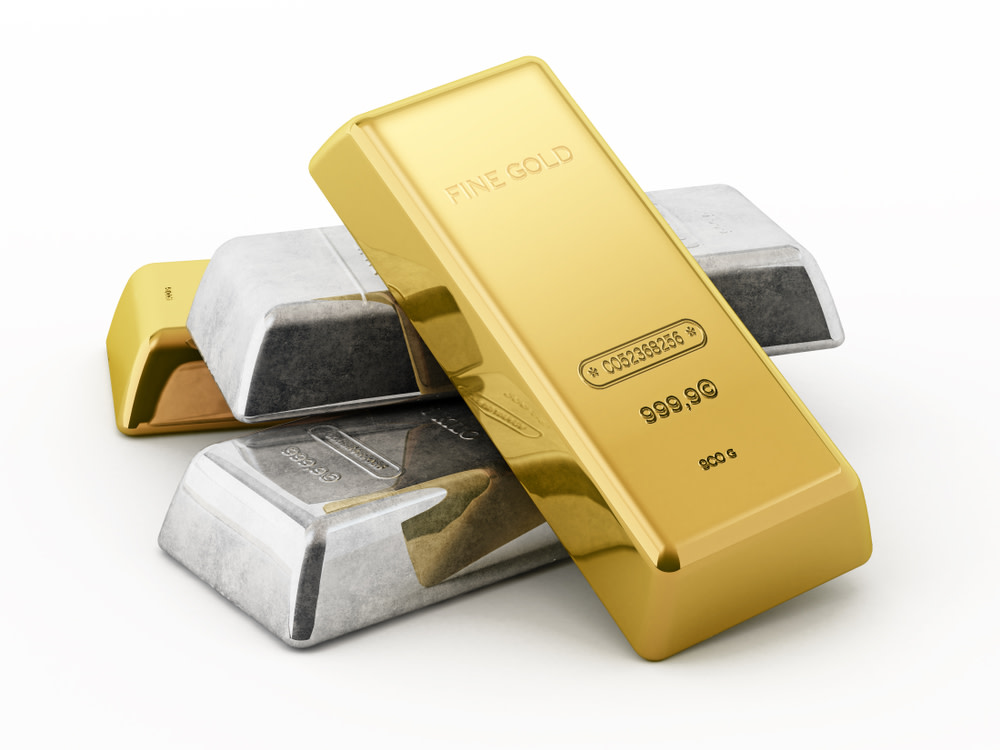
Silver and Gold Spearhead Robust Investment Returns
Shauvik Haldar
|
Overall, major U.S. stock indices went down for the rolling month. Precious metal...
Overview
Returns
Income
Allocations
Fees
About
$250.59
+1.19%
$1.55 T
1.62%
$4.01
24.08%
6.48%
12.65%
11.85%
0.03%
VSMPX | Fund | Other
$228.84
+1.27%
$1.55 T
1.63%
$3.66
24.09%
6.49%
12.67%
-
0.02%
VOO | ETF |
$464.84
+1.26%
$1.07 T
1.57%
$7.20
24.48%
8.31%
13.46%
12.48%
0.03%
VFFSX | Fund | Other
$248.18
+1.20%
$1.07 T
1.58%
$3.85
24.47%
8.31%
13.49%
-
0.01%
FXAIX | Fund | Other
$176.17
+0.02%
$515.22 B
1.26%
$2.21
26.51%
8.32%
13.49%
12.55%
0.02%
SPY | ETF |
$505.65
+1.19%
$503.32 B
1.26%
$6.38
24.33%
8.25%
13.41%
12.42%
-
IVV | ETF |
$507.97
-0.04%
$444.92 B
1.31%
$6.66
26.44%
8.30%
13.50%
12.58%
0.03%
VXUS | ETF |
$59.05
+0.96%
$424.75 B
5.79%
$3.39
8.73%
-0.04%
5.33%
4.18%
0.08%
QQQ | ETF |
$425.07
+1.49%
$254.43 B
0.54%
$2.29
35.43%
8.48%
18.31%
18.09%
0.20%
VUG | ETF |
$331.14
+1.70%
$222.21 B
0.72%
$2.34
34.23%
6.89%
16.04%
14.60%
0.04%
VEA | ETF |
$48.87
+1.01%
$184.11 B
5.04%
$2.44
8.85%
1.63%
6.39%
4.69%
0.05%
VTV | ETF |
$158.13
+0.67%
$162.66 B
2.63%
$4.12
15.35%
8.03%
10.31%
10.07%
0.04%
IEFA | ETF |
$72.16
-0.22%
$109.49 B
2.68%
$1.94
9.79%
1.70%
6.15%
4.65%
0.07%
FCTDX | Fund | Other
$15.83
-0.13%
$93.21 B
1.39%
$0.22
27.49%
7.32%
13.66%
-
0.60%
VIG | ETF |
$176.59
+0.62%
$91.40 B
2.09%
$3.66
14.76%
6.87%
11.42%
11.01%
0.06%
IWF | ETF |
$324.09
+0.02%
$89.17 B
0.55%
$1.78
36.35%
8.26%
16.43%
15.45%
0.19%
FSKAX | Fund | Other
$139.42
0.00%
$88.99 B
0.37%
$0.52
26.28%
6.49%
12.68%
11.95%
0.02%
SWPPX | Fund | Other
$78.03
+1.19%
$87.82 B
1.34%
$1.05
24.45%
8.29%
13.46%
12.46%
0.02%
VYM | ETF |
$117.66
+0.61%
$64.82 B
3.76%
$4.40
13.08%
7.72%
9.45%
9.69%
0.06%
FCFMX | Fund | Other
$16.60
0.00%
$63.71 B
0.42%
$0.07
26.29%
6.49%
-
-
-
FALCX | Fund | Other
$12.68
-0.08%
$60.55 B
1.43%
$0.18
29.00%
8.58%
-
-
0.49%
SCHD | ETF |
$77.77
+0.69%
$56.46 B
3.14%
$2.44
9.99%
4.75%
11.13%
11.12%
0.06%
IWD | ETF |
$173.62
-0.02%
$56.30 B
1.77%
$3.08
16.43%
5.56%
8.96%
8.50%
0.19%
VEU | ETF |
$57.37
+0.93%
$54.37 B
5.93%
$3.37
9.08%
0.19%
5.45%
4.28%
0.07%
ITOT | ETF |
$111.18
+0.06%
$54.28 B
1.11%
$1.23
26.21%
6.47%
12.65%
12.03%
0.03%
VDIGX | Fund | Investor
$37.90
+0.66%
$53.76 B
1.80%
$0.67
8.68%
6.66%
10.72%
10.91%
0.30%
RSP | ETF |
$162.46
+0.89%
$49.98 B
1.67%
$2.72
13.78%
4.88%
10.51%
10.15%
0.20%
VV | ETF |
$232.22
+1.26%
$49.12 B
1.59%
$3.64
25.31%
7.55%
13.38%
12.39%
0.04%
FSPSX | Fund | Other
$48.67
-0.08%
$48.30 B
0.73%
$0.36
10.23%
2.59%
6.53%
4.64%
0.03%
Get the lastest fund and ETF news in your inbox each week.
Receive latest news, trending tickers, top stocks increasing dividend this week and more.

News
Shauvik Haldar
|
Overall, major U.S. stock indices went down for the rolling month. Precious metal...

News
Shauvik Haldar
|
Overall, some of the major U.S. stock indices marginally declined for the rolling...

News
Shauvik Haldar
|
Overall, the U.S. stock markets maintained their positive momentum for the rolling month.

News
Shauvik Haldar
|
Overall, the U.S. stock markets maintained their positive momentum for the rolling month.
Mutual Fund Education
Daniel Cross
|
While CITs and mutual funds share many similarities, there are some key differences...
Taxation
Justin Kuepper
|
Let's see why mutual funds could incur surprise taxes and how tax-managed funds...
Mutual Fund Education
Sam Bourgi
|
The phrase ‘bear market’ has been thrown around a lot lately, but it...
Portfolio Management
Check out our special report on engaging millennials through their increasing interest in...